
Chapter Three is the shortest chapter and the most tightly structured, which is why a panel can dismantle it fastest. This page is one complete methodology chapter, written out in the sections a Nigerian department expects, with an annotation after each one saying what the paragraph is doing and which defence question it closes.
The procedure — what each section is for and the order to write them in — is in our step-by-step guide to Chapter Three. This is the finished text that guide produces.
How to read this
The running study is the education example used across this site: the instructional use of continuous assessment records by secondary school teachers in one local government area. Every specimen is a shape, not a claim. Bracketed italics are yours to replace, [figure] marks a number you must take from a named source, and [cite] marks a citation you must have read. No real author, study or statistic is attached to any sentence here. Nworgu and Osuala are named only as the research methods texts Nigerian departments commonly prescribe, with no definition or wording attributed to either.
3.1 Research design
This study adopts the descriptive survey design. The design is appropriate because the study seeks to describe a practice as it currently exists among a defined population, without manipulating any variable and without assigning respondents to conditions. The first three specific objectives require the level and pattern of an existing practice to be established, and the fourth requires the association between two measured characteristics of the same respondents; a descriptive survey supports both, whereas an experimental design would require an intervention this study neither delivers nor evaluates.
The design is cross-sectional. Data were collected at a single point in the [year] academic session, which means the study establishes association rather than causation, and this is treated as a boundary of the study rather than a defect of it.
Annotation. Three moves: name the design, justify it against your own objectives, and rule out the obvious alternative. The second paragraph pre-empts the single commonest Chapter Three question — “can you claim causation?” — by answering it before it is asked. Note that the justification quotes the objectives rather than a textbook; a design justified by what your study needs is far harder to attack than one justified by a definition.
3.2 Area of the study
The study was carried out in [named LGA] of [named state]. The area was selected because it contains
[figure]public secondary schools under the [named authority][cite], a number large enough to support the sampling procedure described in 3.5 while remaining reachable within the data collection window. The area is predominantly [urban, semi-urban or rural], and its schools operate under a single reporting authority, which means the assessment returns discussed in Chapter One are governed by one set of requirements across the whole sample.
Annotation. Two jobs in one short section. It gives the reader the setting, and it gives a reason for the setting that is methodological rather than convenient. “It is where I live” is the true reason for most undergraduate projects and it is also the one that invites a follow-up; “one reporting authority across the whole sample” is a real design property and it is usually also true.
3.3 Population of the study
The population of the study comprises all teachers of [named subjects] in the
[figure]public secondary schools in [named LGA], numbering[figure]teachers as at [date], according to [named source][cite].The target population is therefore the
[figure]teachers described above. The accessible population is the[figure]teachers in the[figure]schools that granted permission for data collection, permission having been declined or unobtained in[figure]schools. The difference between the two is reported here rather than concealed, and its implication is considered in 3.10.
Annotation. A population figure needs three things: a number, a date, and a source. Most rejected Chapter Threes have the number and neither of the other two. The second paragraph does something few undergraduate projects do and every examiner notices: it separates target from accessible population and states the gap. Volunteering the gap converts it from a weakness the panel finds into evidence that you understand your own sample.
3.4 Sample size determination
The sample size was determined using the Taro Yamane formula, n = N / (1 + Ne²), where n is the sample size, N is the population and e is the level of precision, taken here as 0.05.
Substituting the population of
[figure]teachers:n =
[N]/ (1 +[N]× 0.05²) =[N]/ (1 +[N]× 0.0025) =[N]/[denominator]=[n]The computed sample size is therefore
[n]teachers, rounded up to[n rounded]. To allow for non-response,[figure]additional copies of the instrument were administered, giving[total]distributed.
Annotation. Show the arithmetic in full, on separate lines, with the substitution visible. A panel that can follow your computation will not ask about it; a panel presented with only a final number almost always will. The non-response allowance is a small addition that answers “what if people don’t return them?” in advance. Our guide to where the population figure in a Taro Yamane computation actually comes from covers the part students most often cannot source, and how many respondents a qualitative project needs covers the case where no formula applies.
3.5 Sampling technique
A multi-stage sampling procedure was used. In the first stage, the
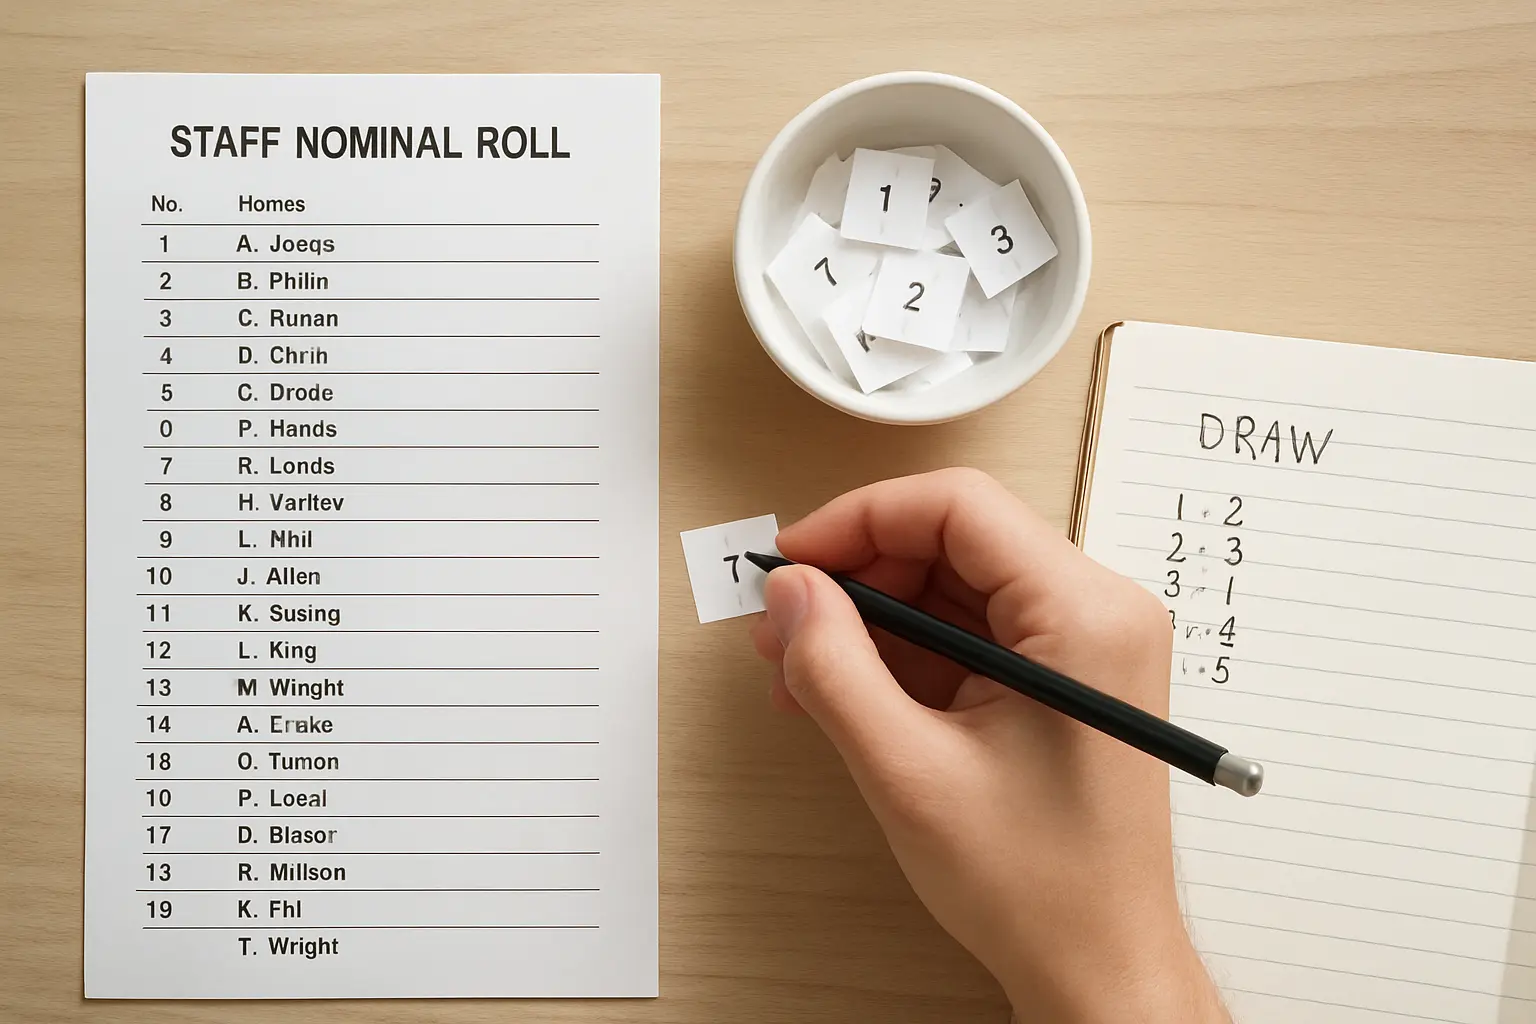
[figure]public secondary schools in the area were stratified by [named stratum: school type, ward, or size band], producing[figure]strata. In the second stage,[figure]schools were selected from each stratum by simple random sampling, using a numbered list of schools obtained from [named source] as the sampling frame and drawing numbered slips without replacement. In the third stage, all teachers of [named subjects] in each selected school were included, since the number per school was small enough to permit a census at that level.
Annotation. Three things make a sampling section defensible: the frame is named, the mechanism of randomness is described (numbered slips, or a random number table, or a spreadsheet function), and the stages are separated. Writing “simple random sampling was used” with no frame and no mechanism is the single most common Chapter Three fault in Nigerian projects, and it is fatal because nothing about it can be checked.
If your sampling was in fact convenience or purposive, say so. An honestly reported purposive sample with a stated selection rule survives a defence. A convenience sample described as random does not, because the first question is how you randomised, and there is no answer.
3.6 Instrument for data collection
The instrument for data collection was a researcher-developed questionnaire titled [Instrument Title] ([ACRONYM]). It consists of
[figure]items in [number] sections.Section A elicits the respondent’s demographic and professional characteristics: sex, years of teaching experience, highest academic qualification, subject taught, and whether the respondent has attended in-service training on assessment. These items correspond to the characteristics examined in the fourth specific objective.
Section B contains
[figure]items on the types of assessment records kept, responded to on a checklist. Section C contains[figure]items on the instructional use of those records, responded to on a four-point Likert-type scale of Strongly Agree (4), Agree (3), Disagree (2) and Strongly Disagree (1). Section D contains[figure]items on constraints, on the same four-point scale.A four-point scale was adopted in preference to a five-point scale in order to avoid a neutral midpoint, since the construct measured is a practice the respondent either performs or does not.
Annotation. Section by section, with the item count for each, and a stated reason for the scale. The last paragraph is the one that separates a considered instrument from a copied one: scale choice is a decision, and a panel that sees the reason will not probe it. Notice too that Section A is justified by pointing at an objective — demographic items that serve no objective are padding and a panel will ask what they were for.
If you adapted a published instrument rather than building one, say so here, name it, and state what you changed and why. Our guide to choosing a validated instrument for an education project covers permission and adaptation.
3.7 Validity of the instrument
The instrument was subjected to face and content validation. Draft copies, together with the study’s title, objectives and research questions, were given to three experts: two from the Department of [department] and one from the Department of [measurement and evaluation or equivalent], [named university].
The validators were asked to assess each item for clarity of wording, relevance to the objective it serves, and adequacy of coverage of the construct. Their observations led to the following changes:
[figure]items were reworded for ambiguity,[figure]items were deleted as duplicative, and[figure]items were added to cover [named aspect], which the validators judged under-represented. The corrected instrument was returned to the validators and approved before the pilot study.
Annotation. This is where most Chapter Threes give one sentence, and where a panel can extract five minutes of discomfort from a student who cannot say what the validators actually changed. Report the changes with counts. “Three items were reworded, two deleted, four added” is evidence that validation happened; “the instrument was validated by experts” is a claim that it did.
3.8 Reliability of the instrument
A pilot study was conducted to establish the reliability of the instrument.
[figure]copies were administered to teachers in [named school or area], a setting comparable to the study area but excluded from the main study to avoid contaminating the sample.Reliability was estimated using Cronbach’s alpha, appropriate here because the Likert-type items are scored on a scale rather than dichotomously. The coefficients obtained were
[figure]for Section C and[figure]for Section D, and[figure]for the instrument as a whole. These values were judged adequate for the study.
Annotation. Four things: the pilot sample size, where it came from, why that setting was excluded from the main study, and a coefficient per subscale rather than one figure for the whole instrument. The exclusion clause matters because a pilot drawn from your own sample is a design fault, and stating that you avoided it closes the question. Our guide to what Cronbach’s alpha value your department will accept covers what to do when the figure comes out low.
3.9 Method of data collection
A letter of introduction was obtained from the Department of [department], [named university], and presented to [the education authority] and to the principal of each selected school. Data collection took place between [date] and [date].
Copies of the instrument were administered by the researcher, assisted by
[figure]trained research assistants who were briefed on the instrument and on the consent procedure. Respondents were informed of the purpose of the study, that participation was voluntary, and that responses would be reported in aggregate without identifying any individual or school. Completed copies were retrieved on the spot where possible and within[figure]days otherwise.Of the
[total]copies distributed,[figure]were returned and[figure]were found usable, giving a response rate of[figure]per cent.[figure]copies were discarded as incompletely filled.
Annotation. The response rate belongs here, in Chapter Three, not discovered by the panel in Chapter Four. Report distributed, returned, usable and discarded as four separate numbers; they will not add up unless you keep the record as you go, which is the real reason to write this section while collecting rather than afterwards. The consent sentences are not decoration — in health and some social science departments they are a requirement, and where ethical clearance applies it is named here.
3.10 Method of data analysis
Data were analysed using [named software]. Research questions one to three were answered using descriptive statistics: frequencies, percentages and mean scores with standard deviations. For the Likert-type items, a criterion mean of 2.50 was adopted, obtained as the arithmetic mean of the four scale points (4 + 3 + 2 + 1) / 4; an item mean of 2.50 and above was regarded as agreement and a mean below 2.50 as disagreement.
Research question four, which concerns the relationship between assessment training and instructional use, was answered using [named test], tested at the 0.05 level of significance. The test was chosen because [the variables’ measurement level and the question’s form].
As the design is cross-sectional and non-experimental, findings are reported as associations, and no causal inference is drawn from them.
Annotation. Three moves. Match each analysis to a numbered research question, so the panel can see that every question has an analysis and every analysis has a question. Show how the criterion mean was derived rather than asserting 2.50, because a student who cannot derive it will be asked to. And close with the limit of inference, which mirrors the opening of 3.1 and makes the chapter internally consistent. Our guide to choosing the right statistical test covers the selection, and analysing project data in SPSS covers the execution.
The seven questions this chapter is built to close
- Why this design and not an experimental one? — closed in 3.1.
- Where did your population figure come from? — closed in 3.3, with a source and a date.
- Target or accessible population? — closed in 3.3, by reporting both.
- How exactly did you randomise? — closed in 3.5, by naming the frame and the mechanism.
- What did your validators actually change? — closed in 3.7, with counts.
- Why was your pilot sample excluded from the main study? — closed in 3.8.
- What was your response rate? — closed in 3.9, before anyone asks.
A Chapter Three that closes those seven is a short defence. Nigerian departments commonly prescribe research methods texts by authors such as Nworgu and Osuala; use whichever your department prescribes for the terminology it expects, and check your department’s own numbering, since some require these sections in a different order or under different headings.
Before you submit it
Read the chapter beside your specific objectives, and check that each one has a matching instrument section and a matching analysis. Then check that the setting described in 3.2 is the same setting named in your scope, and that the population figure here matches any figure used in your background. Inconsistent numbers between chapters are found in seconds and cost more credibility than they should.
Chapter Three rewards precision and punishes vagueness, which is why it is worth drafting properly rather than quickly. Tesify keeps your objectives, instrument and analysis visible together as you write, so the chapter stays consistent with the rest of the project — 100% written by you, alongside 9,000+ students and 15,000+ chapters.
Draft Chapter Three with Tesify
Frequently asked questions
How long should Chapter Three be?
It is usually the shortest chapter, often eight to fifteen pages for an undergraduate project. Length is not the test; completeness of the named sections is. Your department’s guideline governs the section list and the numbering.
What is the difference between target population and accessible population?
The target population is everyone your findings are meant to describe. The accessible population is the subset you could actually reach. Reporting both, and the gap between them, is stronger than reporting one figure and hoping nobody asks.
Do I have to use Taro Yamane?
No. It is the formula most Nigerian departments expect for a finite population with a proportion-type estimate, but other approaches exist, and a qualitative study needs a saturation argument instead of a formula. Use what your design requires and justify it.
Is a four-point or five-point Likert scale better?
Neither is universally better. A four-point scale removes the neutral midpoint and forces a direction, which suits a practice the respondent either performs or does not. A five-point scale allows genuine neutrality. Whichever you use, state the reason in 3.6.
Where does the criterion mean of 2.50 come from?
It is the arithmetic mean of the four scale points, (4 + 3 + 2 + 1) divided by 4. Show that derivation in the chapter. A five-point scale gives a criterion mean of 3.00 by the same method.
How many experts should validate my instrument?
Three is the common expectation in Nigerian departments, usually including one from measurement and evaluation or an equivalent specialism. What matters more than the number is that you report what they changed.
What Cronbach’s alpha is acceptable?
Departments differ, and the figure you report should be per subscale, not just overall. Report the coefficients you obtained rather than a figure you wish you had obtained, and address a low one in the limitations rather than hiding it.
Can the pilot respondents be part of the main sample?
No. Pilot respondents should come from a comparable setting outside your sample, and your chapter should say so explicitly. Using the same respondents contaminates the main data and is a straightforward defence question.
Should the response rate go in Chapter Three or Chapter Four?
Chapter Three, in the data collection section, as distributed, returned, usable and discarded. Chapter Four then analyses the usable copies. Introducing the response rate for the first time in Chapter Four makes it look like a finding rather than a method.
What if my sampling was really convenience sampling?
Say so, name the rule you actually applied, and treat it in the limitations. An honestly reported convenience sample is defensible; a convenience sample described as random is not, because the first question will be how you randomised.
My department numbers these sections differently. Does that matter?
Follow your department. The section numbers here are a common Nigerian arrangement, not a standard. What every version requires is the same content: design, area, population, sample, technique, instrument, validity, reliability, collection and analysis.