
Chapter Four of an accounting final year project in Nigeria presents your financial data (ratios computed from company financial statements, or survey responses if your topic is perception-based), interprets each figure against a trend or benchmark, tests your hypotheses if you have any, and discusses what the results mean. This guide walks through the seven steps in order, with a fully worked, labelled illustrative example built around a fictitious manufacturing company.
What Goes Into Chapter Four of an Accounting Project?
Accounting Chapter Fours split into two common designs. A ratio-analysis design computes financial ratios from a company’s (or several companies’) published financial statements over a period of years and interprets the trend — used for topics on liquidity, profitability, solvency or working-capital management. A survey-based design collects questionnaire responses from accountants, auditors or investors and analyses them with descriptive statistics and, where hypotheses are stated, an inferential test — used for topics on perception, adoption or practice (for example, IFRS adoption or forensic accounting awareness). The seven steps below cover both, with the worked example following the ratio-analysis design, since ratio analysis of published financial statements is one of the most common accounting project designs.
Step 1: Restate Your Research Questions or Hypotheses as the Chapter’s Spine
Open Chapter Four with one short paragraph restating exactly what you set out to measure in Chapter One — not a copy-paste of the whole chapter, just the research questions or hypotheses in the same wording, so every table that follows visibly answers one of them. If Chapter Four does not map back to Chapter One question by question, a panel treats it as page-filling rather than analysis.
Step 2: Present the Data Source and Period Covered
State exactly whose financial statements (or which population of respondents) you used, the exact years covered, and where you obtained them — the company’s published annual reports, the company results and corporate disclosure sections of the Nigerian Exchange (NGX) website, or a questionnaire administered to a named population. This paragraph is what lets your panel judge whether your data is real, complete and appropriately scoped, so name the specific years (e.g. 2022, 2023, 2024) rather than “the past few years.”
Step 3: Compute and Present the Ratios in Tables
Each ratio family gets its own table: one row per year, one column per ratio, with the formula stated once above the table so the panel can check your arithmetic. The four ratio families most Nigerian accounting Chapter Fours use are liquidity (current ratio, quick ratio), profitability (gross profit margin, net profit margin, return on assets, return on equity), solvency (debt-to-equity, interest coverage) and efficiency (inventory turnover, receivables turnover). Pick the two or three families your research questions actually target — presenting every possible ratio without a stated reason is a common examiner complaint.
Step 4: Interpret Each Ratio Against a Trend or Benchmark
A number on its own is not analysis. For each ratio, say whether it rose, fell or stayed flat across your period, by how much, and what that direction means in plain language (a rising current ratio generally signals improving short-term liquidity; a falling interest-coverage ratio signals growing difficulty servicing debt). Where a widely-cited rule-of-thumb exists — a current ratio of about 2:1 is commonly cited as a healthy benchmark, for instance — you may reference it as a general convention, but always as a starting point for discussion rather than a pass/fail line, since acceptable ratios vary meaningfully by industry.
Step 5: Test Your Hypotheses, If You Have Any
If Chapter One stated a hypothesis (for example, that profitability significantly improved after a named policy change, or that two groups of companies’ liquidity positions differ significantly), Chapter Four needs the actual statistical test, not just a ratio table. A significance test needs enough observations: three annual figures for a single company are too few to test, so a hypothesis test usually runs on a sample of companies or on a longer series. A paired-sample t-test suits a before-and-after comparison on the same set of companies; an independent-sample t-test or Mann-Whitney U suits comparing two different groups of companies; Pearson correlation suits testing whether two ratios move together. State the test, the significance level (conventionally 0.05), the computed statistic, and the plain-language decision — reject or fail to reject the null hypothesis.
Step 6: Discuss the Findings Against Your Literature Review
Connect each result back to Chapter Two: does your finding agree with, contradict, or add nuance to what earlier studies found? A finding that simply confirms prior literature is fine, but say so explicitly and note anything about your specific company or period that might explain agreement or difference — this is where the “so what” of your project actually lives.
Step 7: Write the Chapter Summary
Close with a short paragraph restating, in one line each, what each research question’s data showed — this is the paragraph your Chapter Five conclusion will expand on, so write it as a clean, quotable summary rather than a repeat of the whole chapter.
A Worked Example: Liquidity and Profitability Analysis (Illustrative)
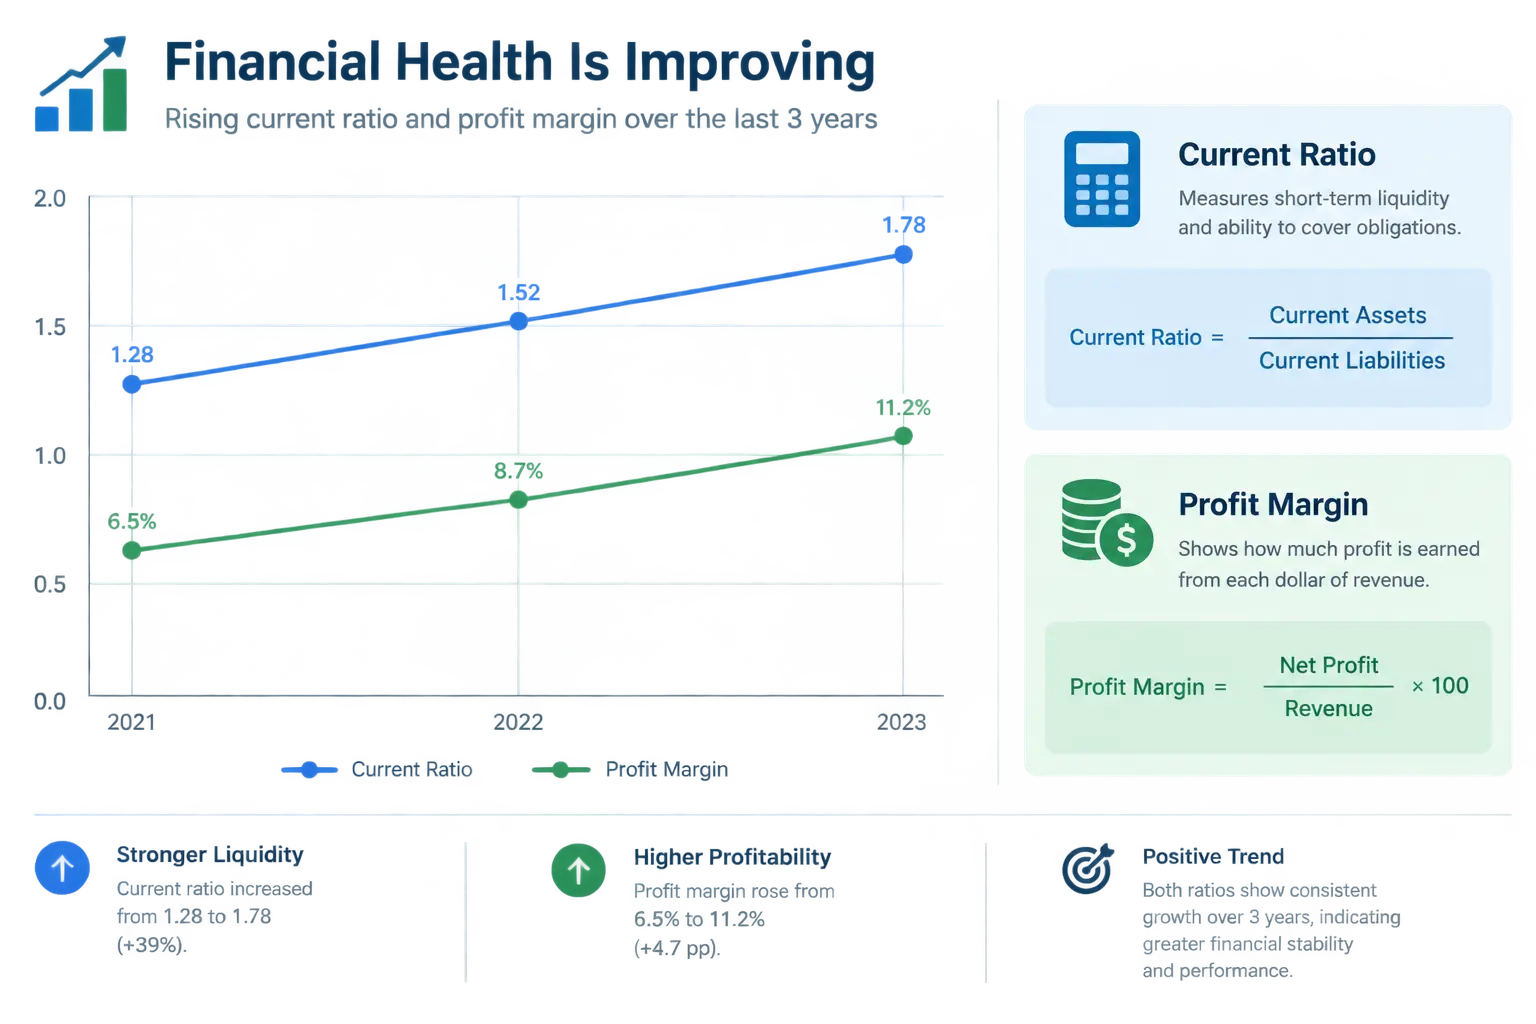
The company name, figures and results below are entirely fictitious and illustrative — built to show the shape of a complete Chapter Four, not to be copied as real data.
Data source paragraph: “This study analysed the published financial statements of ABC Manufacturing Plc (a fictitious company) for the three financial years 2022, 2023 and 2024, obtained from the company’s annual reports.”
| Ratio | 2022 | 2023 | 2024 |
|---|---|---|---|
| Current ratio (current assets ÷ current liabilities) | 1.42 | 1.58 | 1.71 |
| Quick ratio ((current assets − inventory) ÷ current liabilities) | 0.95 | 1.05 | 1.18 |
| Net profit margin (net profit ÷ revenue × 100) | 6.2% | 7.4% | 8.1% |
| Return on assets (net profit ÷ total assets × 100) | 4.8% | 5.6% | 6.3% |
Interpretation paragraph: “ABC Manufacturing Plc’s current ratio rose from 1.42 in 2022 to 1.71 in 2024, an increase of 0.29 points over the period, indicating a strengthening ability to meet short-term obligations from current assets. The quick ratio, which excludes inventory, followed the same upward pattern, rising from 0.95 to 1.18 — moving from below to above the conventional 1:1 benchmark, suggesting the improvement in liquidity is not driven by inventory build-up alone. Net profit margin improved from 6.2% to 8.1% across the same three years, a gain of 1.9 percentage points, alongside a similar rise in return on assets from 4.8% to 6.3%. Read together, the three-year trend shows the company improving both its short-term liquidity position and its profitability at the same time, rather than trading one for the other.”
Hypothesis-test paragraph (illustrative; if H1 stated that profitability improved significantly across a sample of ten listed manufacturing companies, including ABC): “A paired-sample t-test comparing the net profit margins of the ten sampled companies in 2022 against the same companies in 2024 was computed (illustrative t = 3.12, df = 9, p = 0.012), which is below the 0.05 significance threshold. The null hypothesis of no significant difference is therefore rejected, and it is concluded that profitability across the sampled companies improved significantly between 2022 and 2024.” Note that a single company’s three yearly figures, on their own, would support only the descriptive trend reading above, not a significance test.
What Changes If Your Design Is Survey-Based Instead of Ratio-Based?
If your accounting topic is perception- or practice-based (IFRS adoption awareness, forensic accounting practice, tax compliance attitudes), Chapter Four keeps the same seven-step spine but swaps the content of Steps 2–5. Step 2 becomes a respondent bio-data table (gender, years of experience, qualification, role) instead of a data-source paragraph. Step 3 becomes descriptive statistics — frequency counts and percentages for each questionnaire item, or means and standard deviations for Likert-scale items — instead of ratio tables. Step 4’s interpretation reads the percentages or means against your response options rather than against a financial benchmark. Step 5’s hypothesis test typically becomes a chi-square test of independence (for categorical relationships, such as qualification versus awareness level) or a one-sample t-test against a neutral midpoint (for Likert-scale agreement questions) rather than a paired-sample comparison. Steps 1, 6 and 7 — restating your questions, discussing against Chapter Two, and the chapter summary — stay identical in structure regardless of which design you use.
Common Faults That Get a Chapter Four Sent Back

| Fault | Fix |
|---|---|
| Ratios presented with no interpretation sentence | Every table needs a paragraph saying what the numbers mean, not just the numbers |
| Every possible ratio computed with no link to the research questions | Compute only the ratio families your Chapter One actually asks about |
| A stated hypothesis with no statistical test performed | If Chapter One has a hypothesis, Chapter Four must show the actual test and decision |
| A significance test run on too few observations | Test across a sample of companies or a longer series; a single company’s handful of yearly figures supports trend description only |
| Arithmetic that does not match the stated formula | Recompute every ratio from the raw figures before typing the table; a single wrong ratio undermines the whole chapter’s credibility |
| Discussion section that repeats the interpretation instead of engaging Chapter Two | Explicitly compare your finding with at least one cited prior study per research question |
Frequently Asked Questions
Do I need three years of financial statements, or is one year enough?
Many supervisors prefer at least three consecutive years so you can show a trend rather than a single snapshot — check your own department’s specific requirement, since expectations differ and some accept two years for a narrower topic.
What if my chosen company does not publish enough detail in its annual report?
Confirm data availability before finalising your topic, not after — the company results and corporate disclosure sections of the Nigerian Exchange website and the company’s own investor-relations page are the two places to check first; if the detail is not there, choose a different company or narrow your ratio families to what is actually reported.
Can I compare two companies instead of tracking one company over time?
Yes — a cross-sectional comparison between companies in the same sector is a valid alternative design; it uses the same ratio tables, and if you test a hypothesis you need enough companies in each group for an independent-sample test. Your data-source paragraph should name the companies and confirm you are comparing the same financial year for each.
Which statistical software should I use to compute the significance test?
SPSS and Excel’s built-in data-analysis functions both compute a paired or independent t-test; SPSS is widely used in Nigerian accounting departments and produces the output tables panels are used to seeing, but confirm with your supervisor which is acceptable.
Is it acceptable to round my ratios to two decimal places?
Yes, two decimal places (or one for percentages) is standard practice and keeps tables readable — just be consistent across every table in the chapter.
What benchmark should I use if my department has not given me one?
In the absence of a department-specified benchmark, cite a widely-used general convention (such as the 2:1 current-ratio rule of thumb) as your reference point, but explicitly note in your discussion that acceptable ratios vary by industry and that the benchmark is a starting point, not a strict standard.
Do I need to test every ratio for statistical significance?
No — only test the ratios tied to a stated hypothesis in Chapter One. Ratios presented purely for descriptive trend analysis do not need a significance test, only a clear interpretation of the trend.
Computing ratios correctly, interpreting them without contradicting your own numbers, and keeping Chapter Four tightly linked to your Chapter One questions is the kind of structured chapter work Tesify is built to support. More than 9,000 students have used Tesify to write over 15,000 chapters, and every one is 100% written by you: the figures, the interpretation and the discussion remain your own work. Start your project with Tesify and approach Chapter Four with a clear plan.
Before you get to Chapter Four, make sure your accounting project tool stack is set up for ratio analysis and citations, and see the accounting and business administration topics list if you are still choosing a company or angle. Know where the line is between AI help and misconduct in an accounting project before you use any tool on your ratio computations. For the generic mechanics of any Chapter Four, see how to write Chapter Four of a final year project, and if you need the statistical test itself explained step by step, see how to analyse project data in SPSS.