An accounting final year project in Nigeria needs five tools, used in this order: a spreadsheet for ratio and trend analysis, statistical software for hypothesis testing, a reference manager, an AI writing and editing assistant, and presentation software for your defence. Here is how to set up each one, why the order matters, and what each tool actually does for your project.
Why does the order of tools matter?
Each tool in this stack consumes the output of the one before it, so starting out of order creates rework. Statistical software needs clean ratios computed in a spreadsheet, not raw figures typed in by hand a second time. A reference manager only saves time if it is running before you read your first Chapter Two source, not retrofitted after fifty sources are already cited by hand. An AI editor works on a draft that already has its numbers fixed, because editing prose around a number you are still going to change wastes the edit. Building the stack in sequence — spreadsheet, statistics, references, editing, slides — means each stage locks in work the next stage can trust, and it mirrors the order your supervisor will actually mark the chapters in: methodology and instrument choice first, results next, then the finished write-up.
Step 1: Set up your spreadsheet for ratio and trend analysis
Most Nigerian accounting projects analyse published financial statements — annual reports of NGX-listed companies, a bank’s disclosed accounts, or a small business’s records supplied for a case study — and the spreadsheet is where that analysis starts, before it ever reaches Chapter Four. In Microsoft Excel or Google Sheets:
- Build one worksheet per company or per year, with a fixed row order (current assets, current liabilities, revenue, cost of sales, and so on) so your ratio formulas reference the same cell positions across every sheet.
- Compute your ratios with formulas, not typed numbers. Current ratio as
=CurrentAssets/CurrentLiabilities, return on assets as=NetIncome/TotalAssets, so a correction to one input recalculates every dependent ratio automatically — a panel will ask you to defend a number you cannot recompute on the spot. - Use a pivot table to summarise ratios by year or by firm before you chart them; a pivot table is also the fastest way to catch a transcription error, because an outlier ratio jumps out in a summary the way it does not in a raw sheet.
- Chart trends with a line chart across years and a clustered column chart to compare firms — these are the exhibits Chapter Four expects, not a screenshot of the spreadsheet itself.
Step 2: Move to statistical software once you need a hypothesis test
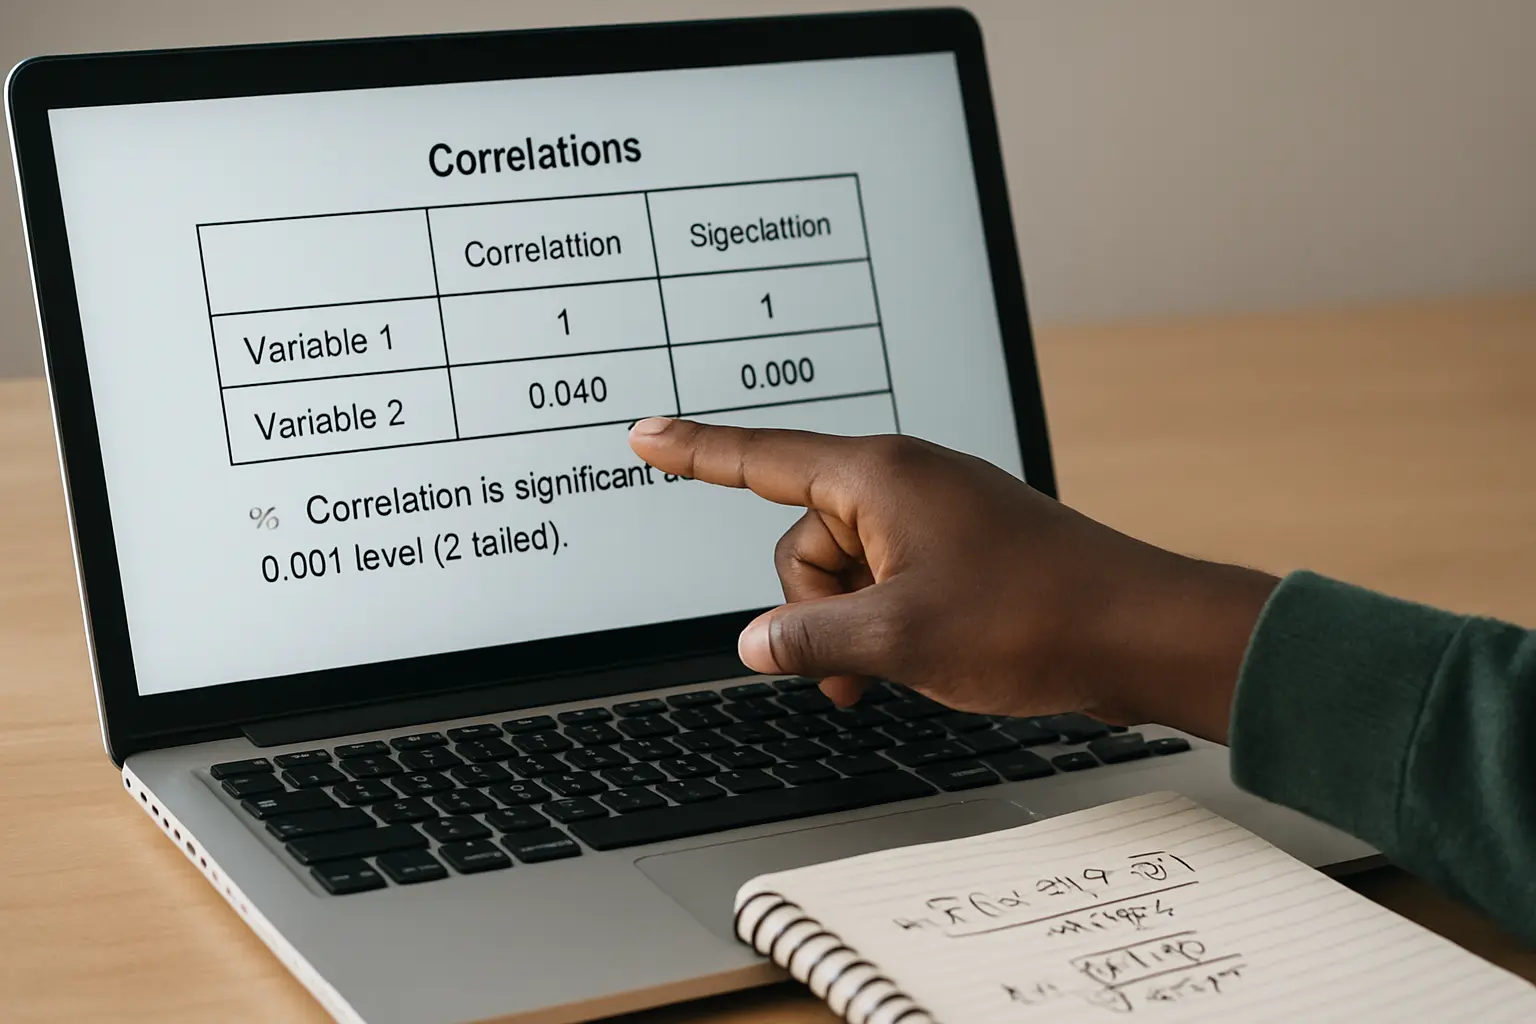
A ratio trend on its own supports description, not a hypothesis. If your Chapter One states a hypothesis — “there is no significant relationship between liquidity and profitability” is a common one in Nigerian accounting projects — you need a correlation or regression test, and Excel’s built-in statistics are thin for that. SPSS, JASP, or jamovi each run Pearson correlation, linear regression, and the significance tests your Chapter Four table needs to report a p-value against your stated alpha (almost always 0.05 in Nigerian departments). Export your Excel ratio table as a CSV, import it into whichever package your department already supports (SPSS remains the default because senior lecturers and past students already know its menus), and keep the exported CSV as a checkpoint — if a number in your SPSS output looks wrong, you can trace it back to the same spreadsheet cell rather than starting the analysis over.
Step 3: Set up a reference manager before you start Chapter Two
Accounting projects lean heavily on standards documents (IFRS, the Financial Reporting Council of Nigeria’s pronouncements), journal articles, and NGX or CBN publications, all of which need consistent APA citation across a reference list that can run to sixty or more entries. Doing this by hand invites exactly the kind of inconsistency a supervisor flags in the first read of Chapter Two. Mendeley or Zotero, set up before you write your first paragraph, attaches a citation to every source as you read it and formats your full reference list in one operation once Chapter Five is done — the alternative is retyping sixty references by hand the night before submission.
Step 4: Use an AI editor for structure and consistency, not for the numbers
An AI writing assistant is useful for tightening the prose of your literature review, checking that your Chapter Three methodology paragraph matches the tense conventions your Chapter Three guide expects, and flagging inconsistent terminology (switching between “profitability” and “financial performance” for the same variable confuses a panel). It should never generate your ratio figures or invent a data source — every number in an accounting project must trace back to a financial statement or a database you can name and, if asked, produce. Tesify’s editor is built around this boundary: it edits your writing and checks your structure and referencing, and it will flag an unsourced figure rather than quietly accepting it.
Step 5: Prepare your defence slides last, from your finished tables
Build your defence slides only after Chapters Four and Five are stable, and pull every chart directly from your spreadsheet rather than redrawing it in PowerPoint — a slide that shows a different number from your printed Chapter Four table is the fastest way to lose credibility with a panel mid-defence. Six to ten slides is typical: topic and objectives, methodology in one slide, your key ratio findings as charts, your hypothesis test result, your conclusion, and your recommendations.
What free-tier limits should you plan around?
Google Sheets is free without limit for the ratio-analysis stage, and jamovi and JASP are free forever with no feature paywall, which makes either a workable substitute for SPSS if your department does not mandate it and your computer lab licence is unavailable off campus. Zotero’s free tier includes 300 MB of personal cloud storage, enough for a reference library well beyond a single project’s needs; Mendeley’s free tier is broadly comparable. Where budget genuinely matters is a paid SPSS licence off campus — most Nigerian students instead use the university computer lab’s licensed copies, or run the analysis on JASP and report it in the same table format SPSS would produce, since the statistic itself does not change with the software. A free plan is the right way to start with an AI editor too: confirm the tool actually improves your specific draft before committing to a paid tier.
Worked example: a ratio-analysis tool chain, start to finish
Consider a project comparing liquidity and profitability across five NGX-listed manufacturing firms over a labelled five-year period — a scope close to what a banking and finance topic in the same data family would use. In Excel, the student builds one sheet per firm, computes current ratio and return on assets by formula, and produces a pivot summary by year. The pivot output — say, a mean current ratio of 1.42 and a mean return on assets of 6.8 per cent across the illustrative sample — is exported as a CSV. In SPSS, a Pearson correlation between current ratio and return on assets returns a coefficient the student reports with its significance level against the stated alpha of 0.05, and this is the number Chapter Four builds its interpretation paragraph around. Every ratio and every figure used in the correlation traces back to a line in the original annual report, cited through Zotero, and the final write-up passes through the AI editor for consistency before the student rebuilds three charts as defence slides from the same spreadsheet. Nothing in this chain is invented after the spreadsheet stage — the tools change format, not the underlying number.
How does this tool stack differ from a general project’s Chapter Three tools?
A generic final year project’s Chapter Three tool discussion covers instrument design and general statistical software. An accounting project’s tool stack is narrower and more sequential because the “instrument” is not a questionnaire but a set of published financial statements, so the spreadsheet stage does work a survey-based project does not need — cleaning and formula-checking secondary data rather than designing and piloting a primary instrument. Where a survey-based project spends its early weeks on questionnaire validity, an accounting project spends them on verifying that every ratio formula references the correct financial-statement line, which is why Step 1 above is worth doing carefully rather than rushing to the statistics package.
Frequently asked questions
Do I need SPSS specifically, or will Excel’s Data Analysis add-in do?
Excel’s Analysis ToolPak can run a basic regression and correlation, and it is acceptable in some departments for a simple two-variable test. Most Nigerian accounting departments still expect SPSS output format for the results table, so confirm with your supervisor before submitting Excel-only statistics.
Is Google Sheets acceptable instead of Excel?
Yes for the ratio-analysis stage — the formulas and pivot tables work the same way — but Google Sheets has no built-in inferential statistics, so you will still need SPSS, JASP, or jamovi for hypothesis testing.
Which reference manager do Nigerian accounting departments prefer?
Neither is mandated nationally; Mendeley and Zotero both produce APA-formatted reference lists that meet department requirements. Zotero is free with no storage cap trade-off at the plan Nigerian students typically need; Mendeley’s interface is more familiar to some older supervisors.
Can I use an AI tool to calculate my financial ratios for me?
No AI tool should generate a ratio you cannot trace back to a specific line in a financial statement. Use a spreadsheet formula for the calculation itself, and reserve AI tools for editing, structure, and referencing.
What if the company I am studying does not publish enough years of data?
State this as a limitation rather than substituting an estimated figure — a shorter but fully traceable dataset defends better than a longer dataset with an invented data point.
Do I need presentation software beyond PowerPoint?
No. PowerPoint or Google Slides is sufficient for a project defence; the content and traceability of your charts matter far more than the software used to display them.
Should my tool stack differ for a qualitative accounting project, such as a case study on internal controls?
Yes — a qualitative accounting project relies less on SPSS and more on a coding approach for interview or document data, but the spreadsheet, reference manager, AI editor, and presentation tool steps still apply in the same order.
What is the single biggest tool-stack mistake accounting students make?
Starting the reference manager after Chapter Two is already drafted. Retrofitting citations into a written chapter takes longer than citing as you read, and it is the step most students skip until the week before submission, when it costs the most time.
Tesify keeps your Chapter Three tool choices, your Chapter Four tables, and your reference list consistent as you move between spreadsheet, statistics package, and write-up. Try the free plan to set up your accounting project’s tool stack this week.