
| Model | What it measures | Questionnaire | Strength | Weakness |
|---|---|---|---|---|
| SERVQUAL (Parasuraman, Zeithaml and Berry, published 1988) | Service quality as the gap between what customers expect and what they perceive they received | 22 expectation items and 22 matched perception items, grouped into five dimensions: reliability, assurance, tangibles, empathy and responsiveness | Gives a gap score for every dimension, so you can say where service falls short of expectations | Long, since every respondent answers 44 items. Critics argue that the definition of expectations is ambiguous and that the five-dimension structure is not universal across settings |
| SERVPERF (Cronin and Taylor, 1992, Journal of Marketing, 56(3), 55–68) | Service quality as performance alone, with no expectation scores | Only the perception (performance) part, which makes it considerably shorter than SERVQUAL | Shorter and easier to administer in a single sitting; the authors found a performance-based measure may be an improved way of measuring service quality | No gap score, so you cannot report the difference between expectation and performance |
| Adapted versions (for example LibQUAL+ for libraries, EDUQUAL for education, HEALTHQUAL for healthcare) | The same idea, reworded for a particular sector | Sector-specific items and sometimes sector-specific dimensions | Wording that fits a hospital, library or university better than the generic items | Each has its own validation evidence, so you must cite and check that evidence |
Which One Should You Choose?
Choose SERVPERF if your objectives ask how good the service is in the eyes of its customers and you will reach each respondent once, for a few minutes, in a queue, a ward or a lobby. Its shorter questionnaire gives better response rates in the setting most students work in. Choose SERVQUAL as the runner-up when your supervisor or your objectives specifically want the gap between expectation and perception, for example “to determine the gap between what customers expect and what they perceive in the bank’s service”, and you can afford the longer instrument. If your sector has an adapted instrument with published evidence, such as a hospital or a library, check it before you adapt the generic items yourself.
The model you choose decides your objectives, your hypotheses and your analysis, so decide before you write Chapter One rather than after you have collected data.
What Is Service Quality, and What Frames It?
Service quality is how well a service meets what customers need and expect, judged by the customer rather than by the provider. The conceptual model behind SERVQUAL was set out by Parasuraman, Zeithaml and Berry (1985) in an article titled “A Conceptual Model of Service Quality and Its Implications for Future Research” in the Journal of Marketing. Their model identifies five gaps that may cause customers to experience poor service quality. Gap 5, the difference between expectations and perceptions, is the only one directly measured by SERVQUAL, and gaps 1 to 4 have diagnostic value because they point to probable causes of service failure inside the provider.
The performance-based approach has its own evidence. Cronin and Taylor (1992) investigated the relationships between service quality, consumer satisfaction and purchase intentions. Their results suggest that a performance-based measure of service quality may be an improved means of measuring the construct, that service quality is an antecedent of consumer satisfaction, that satisfaction has a significant effect on purchase intentions, and that service quality has less effect on purchase intentions than satisfaction does. Those four findings are a ready source of hypotheses and also tell you that service quality and satisfaction are different variables: define each one. Our guide to the definition of terms shows how to define both conceptually and operationally, and the article on the conceptual framework shows how to draw service quality, satisfaction and loyalty into one diagram.

What Are the Five Dimensions?
Both models are organised around the same five dimensions, here described in plain terms.
- Reliability: whether the promised service is delivered dependably and accurately.
- Assurance: whether staff are knowledgeable and courteous and make customers feel confident.
- Tangibles: the physical facilities, equipment and appearance of staff and materials.
- Empathy: the caring, individual attention given to each customer.
- Responsiveness: willingness to help customers and provide prompt service.
Use the exact dimension names from the source you cite, and write your own operational definition for each in the setting you study. A bank, a hospital and a hotel will each give “tangibles” a different meaning, which is why many students adapt the wording of the items while keeping the dimensions.
How Do You Adapt the Items to Your Setting?
- Start from the published items and keep the structure of the five dimensions.
- Change the nouns, not the meaning. “Excellent banks should have modern-looking equipment” becomes a statement about the equipment of the bank you study. Keep each item about one thing.
- Record every change in an appendix table that shows the original item and your version.
- Get the adapted version validated. Experts judge whether each item still measures its dimension, and a pilot gives you a reliability coefficient; the process is in our guide to the validity and reliability of a research instrument.
- Check permission. Read the terms of use of the version you adapt and cite it.
Whichever version you use, report Cronbach’s alpha separately for each dimension, because alpha assumes the items of a scale measure one thing. Our article on what a good Cronbach’s alpha is explains how to read it.
How Do You Analyse the Data?
With SERVPERF
Compute the mean perception score for each dimension and for the whole instrument. Rank the dimensions from highest to lowest, describe them with standard deviations and then test any hypotheses, for example whether perceived service quality differs between branches, or whether it predicts satisfaction or loyalty, using correlation or regression.
With SERVQUAL
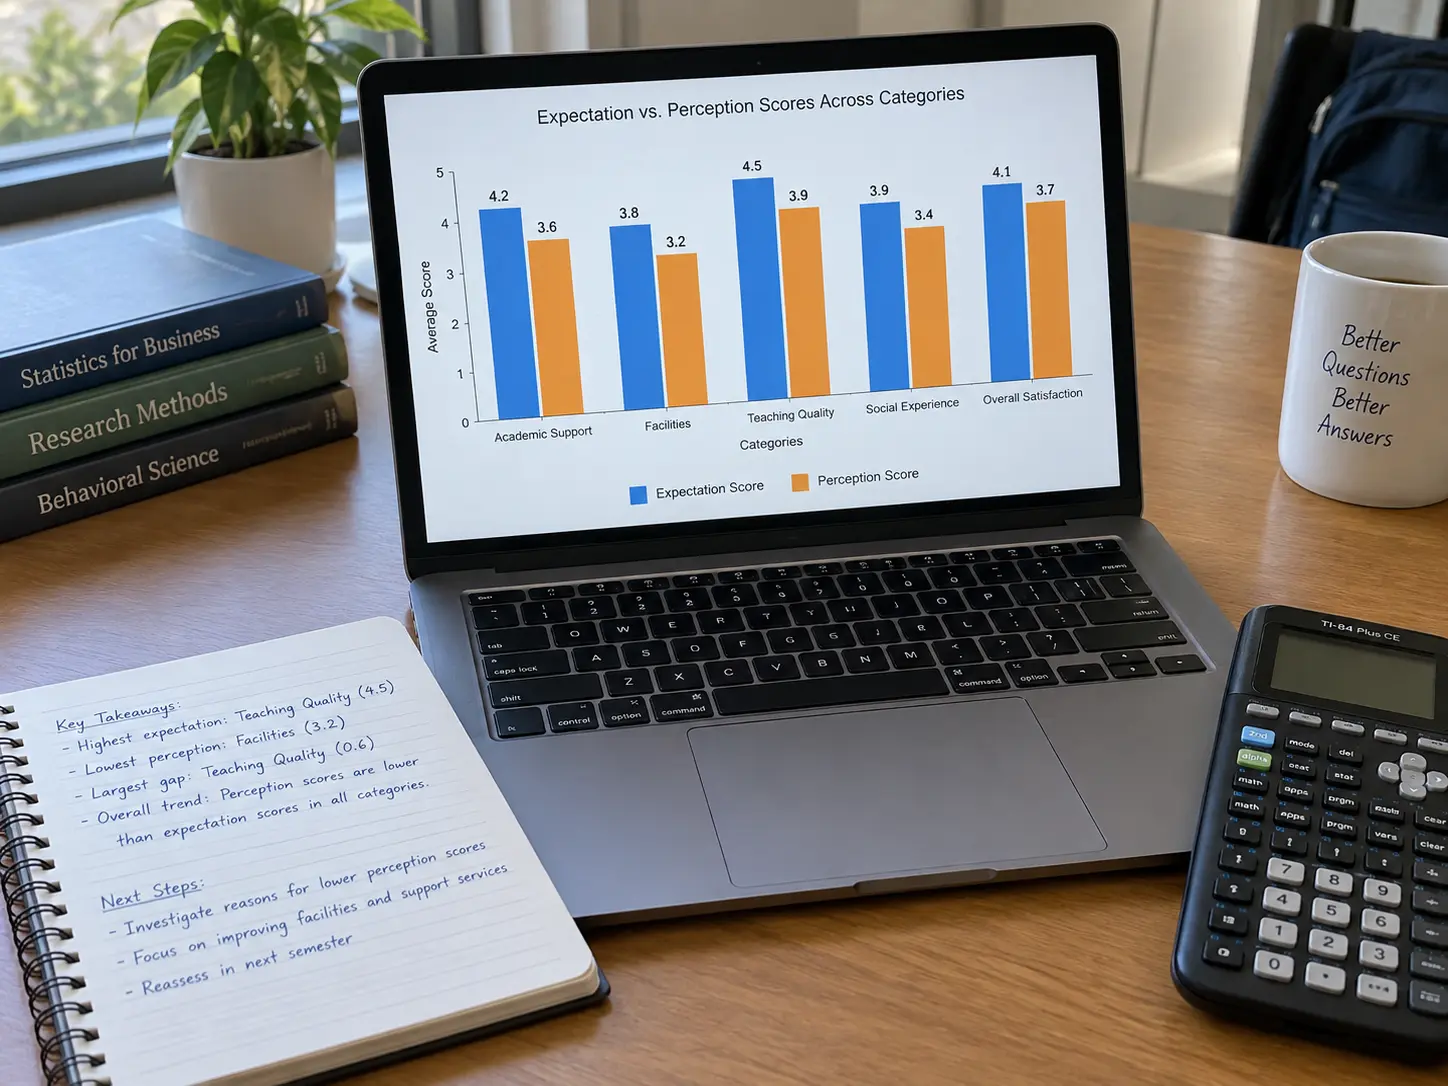
Compute the mean expectation score and the mean perception score for each dimension, then subtract: gap = perception − expectation. A negative gap means that service falls short of expectations. The worked table below is fictitious and shows the layout and the arithmetic only. Scores are on a five-point scale.
| Dimension | Mean expectation | Mean perception | Gap (perception − expectation) |
|---|---|---|---|
| Tangibles | 4.3 | 3.9 | −0.4 |
| Reliability | 4.6 | 3.8 | −0.8 |
| Responsiveness | 4.5 | 3.6 | −0.9 |
| Assurance | 4.4 | 4.0 | −0.4 |
| Empathy | 4.2 | 3.7 | −0.5 |
| Overall mean | 4.40 | 3.80 | −0.60 |
Check the arithmetic: the five expectation means add to 22.0 and 22.0 divided by 5 is 4.40; the five perception means add to 19.0 and 19.0 divided by 5 is 3.80; the five gaps add to −3.0 and −3.0 divided by 5 is −0.60, which equals 3.80 minus 4.40. In this fictitious bank, the largest shortfalls are in responsiveness and reliability, and the smallest are in tangibles and assurance. In your discussion you would link that pattern to the literature and to the setting, and then suggest what the provider could do. Where you want to know whether the gap is statistically significant, a paired comparison of each respondent’s expectation and perception scores is the matching test, and you should write the choice of test into Chapter Three before you collect data.
What Do the Objectives and Hypotheses Look Like?
Here is an illustrative set for a SERVPERF project on a bank. Replace the setting and variables with your own.
- Objective 1: to determine customers’ perception of service quality in the selected bank. Question: how do customers perceive the service quality of the selected bank?
- Objective 2: to identify which service quality dimension is rated highest and lowest. Question: which of the five dimensions is rated highest and which lowest?
- Objective 3: to examine the relationship between service quality and customer satisfaction. Hypothesis (null): there is no significant relationship between service quality and customer satisfaction.
For a SERVQUAL project, add the gap objective and a hypothesis that the gap is not significant.
How Do You Write the Instrument Paragraph and Choose the Sample?
The Chapter Three paragraph on the instrument names the model, its source, the number of items and the dimensions, the scale, any adaptation and the reliability plan, in that order. An illustrative version for SERVPERF reads: “Service quality was measured with a performance-based questionnaire following Cronin and Taylor (1992), adapted to the banking setting and covering the five dimensions of reliability, assurance, tangibles, empathy and responsiveness. Respondents rated each statement on a five-point scale from strongly disagree to strongly agree. The adapted items were reviewed by experts for relevance and clarity and were piloted on customers of a different branch, and internal consistency was computed for each dimension.”
For the sample, your population is the customers or users of the service during your study period. A list of customers is rarely available, so most students use a convenience or systematic approach at the point of service, for example every third customer leaving the branch. Explain how you chose respondents, say how many agreed to take part, describe who was left out, and state in the limitations that a point-of-service sample describes the people present, not every customer. Ask the manager for permission in writing, keep the survey anonymous and do not collect account details. Read the Chapter Three structure in our methodology chapter guide before you finalise the design.
What Titles Can You Use?
A researchable title names the service, the customers and the place. These ten are illustrative starting points; confirm with your supervisor that each is allowed and that you can reach the respondents.
- Service quality and customer satisfaction in selected deposit money banks in Lagos State
- Patients’ perception of service quality in the outpatient department of a teaching hospital
- Service quality and customer loyalty in the hotel industry in Abuja
- Students’ perception of library service quality in a federal university
- Service quality and passenger satisfaction in a domestic airline
- Service quality of mobile network operators and customer retention in Port Harcourt
- Service quality and patronage of restaurants and fast-food outlets in Ibadan
- Service quality in a state water corporation and consumer satisfaction
- Service quality in a polytechnic’s student affairs unit as perceived by students
- Service quality and customer satisfaction in the insurance sector
Titles 1, 5, 6 and 10 suit marketing, banking and business administration; titles 2 and 8 suit health management and public administration; titles 4 and 9 suit education and library studies. Compare this construct with job satisfaction, which looks at staff rather than customers, in our guide to a project on job satisfaction.
What Mistakes Do Panels Flag?
- Using the generic items without adapting them to your sector.
- Choosing SERVQUAL but analysing only perceptions, or choosing SERVPERF and then reporting gaps. The model decides the analysis.
- Mixing service quality with satisfaction. They are different variables, so define and measure each.
- One alpha for the whole instrument. Report it per dimension.
- Asking respondents to rate expectations after they have been served without saying so. State when expectations were measured.
- Sampling only the customers in the lobby on one afternoon. Explain your sampling and its limits.
Tesify helps you structure and organise your project, and the text is 100% written by you. Start your project with Tesify — 9,000+ students have written 15,000+ chapters with Tesify.
Frequently asked questions
What is the difference between SERVQUAL and SERVPERF?
SERVQUAL measures service quality as the gap between expectation and perception, using matched expectation and perception items. SERVPERF measures it from performance (perception) alone, so it is shorter and has no gap score.
How many items does SERVQUAL have?
The questionnaire consists of 22 expectation items and 22 matched perception items, organised into five dimensions.
Which is better for a final year project?
SERVPERF is usually easier to administer because it is shorter. Choose SERVQUAL if your objectives require the expectation–perception gap.
What are the five dimensions of service quality?
Reliability, assurance, tangibles, empathy and responsiveness.
Can I adapt the items to my sector?
Yes, and most students do, but record each change, have the adapted version validated by experts, pilot it, report reliability and cite the source and its terms of use.
Is service quality the same as customer satisfaction?
No. Cronin and Taylor (1992) treat service quality as an antecedent of satisfaction, so they are related but different variables. Define and measure each separately.
How do I calculate a SERVQUAL gap?
Subtract the mean expectation score from the mean perception score for each dimension. A negative value means service falls short of expectations.
Which statistical test fits a gap analysis?
A paired comparison of each respondent’s expectation and perception scores matches the design. Confirm the choice with your supervisor.
Where can I find an adapted version for my sector?
Adapted instruments exist for libraries, education and healthcare, among others. Search for the sector name with the model name, then check the validation evidence and the terms of use.