| Tool | Cost | Best for a pharmacy project | Learning curve |
|---|---|---|---|
| SPSS | Paid licence | KAP (knowledge, attitude, practice) surveys, descriptive statistics, chi-square, t-tests, ANOVA — the tests most pharmacy practice and social pharmacy projects need | Low; menu-driven, no coding required |
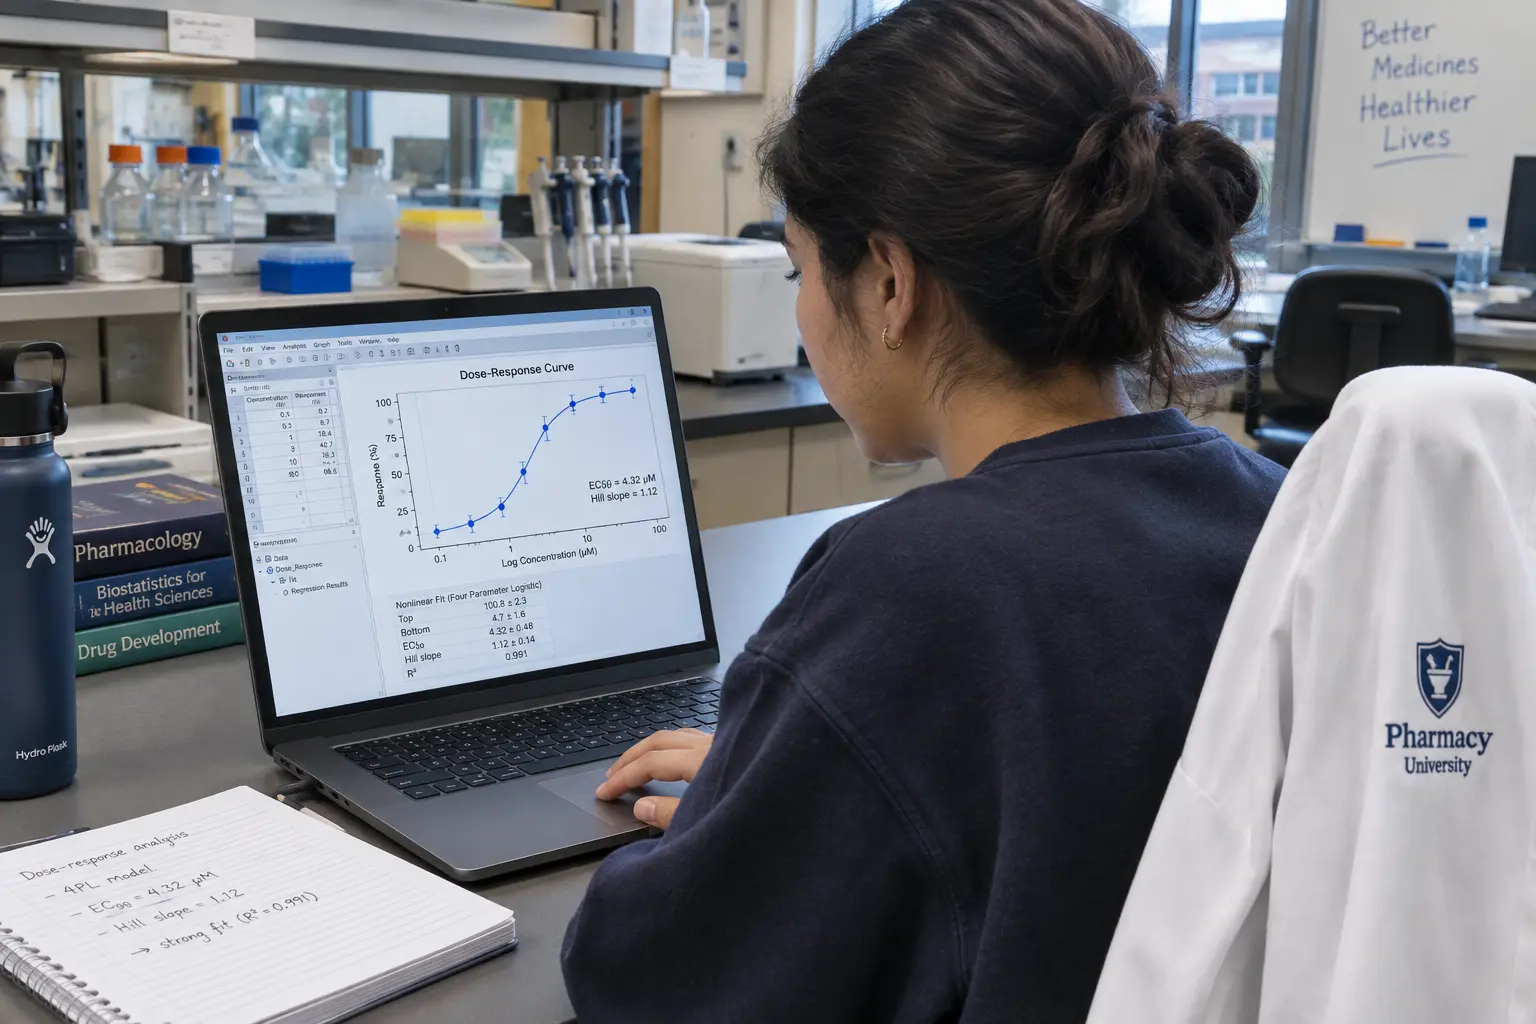
| GraphPad Prism | Paid, free trial available; no price shown on the product page itself — check the vendor’s current pricing directly | Dose-response curves, EC50/IC50 calculations, pharmacology and pharmaceutical-sciences lab data, publication-quality graphs | Low to moderate; built specifically for the graph types pharmacology data produces |
| R | Free, open-source | Anything SPSS or Prism can do, plus more advanced pharmacokinetic and pharmacometric modelling, if you are willing to write code | Steep; command-line, but no cost is ever a barrier |
| jamovi / JASP | Free, open-source | The same menu-driven survey tests as SPSS (descriptives, chi-square, t-tests, ANOVA), at zero cost | Low; menu-driven like SPSS, no coding required |
| Microsoft Excel | Paid (bundled with Office, which many students already have) or free alternatives exist | Data entry, basic descriptive statistics, simple charts; a starting point before moving to dedicated software | Low; already familiar to most students |
Recommendation and Runner-Up
For most Nigerian pharmacy final year projects — which are mostly KAP surveys, practice audits, or drug-utilisation studies rather than laboratory dose-response work — SPSS is the right default: it is widely taught in Nigerian pharmacy departments, it handles every test a survey-based project needs, and it is menu-driven, so you do not need to learn a programming language under deadline pressure. If your project instead involves laboratory pharmacology data — a dose-response curve, an EC50 or IC50 calculation, a pharmacokinetic profile — the better fit is GraphPad Prism, which is purpose-built for exactly these curve types and produces the kind of graph a pharmacology supervisor expects to see. The free runner-up for either case is R: it can do everything both paid tools do and more, at zero cost, provided you are willing to invest time learning its syntax rather than a menu.
Why SPSS Fits the Most Common Pharmacy Project Design
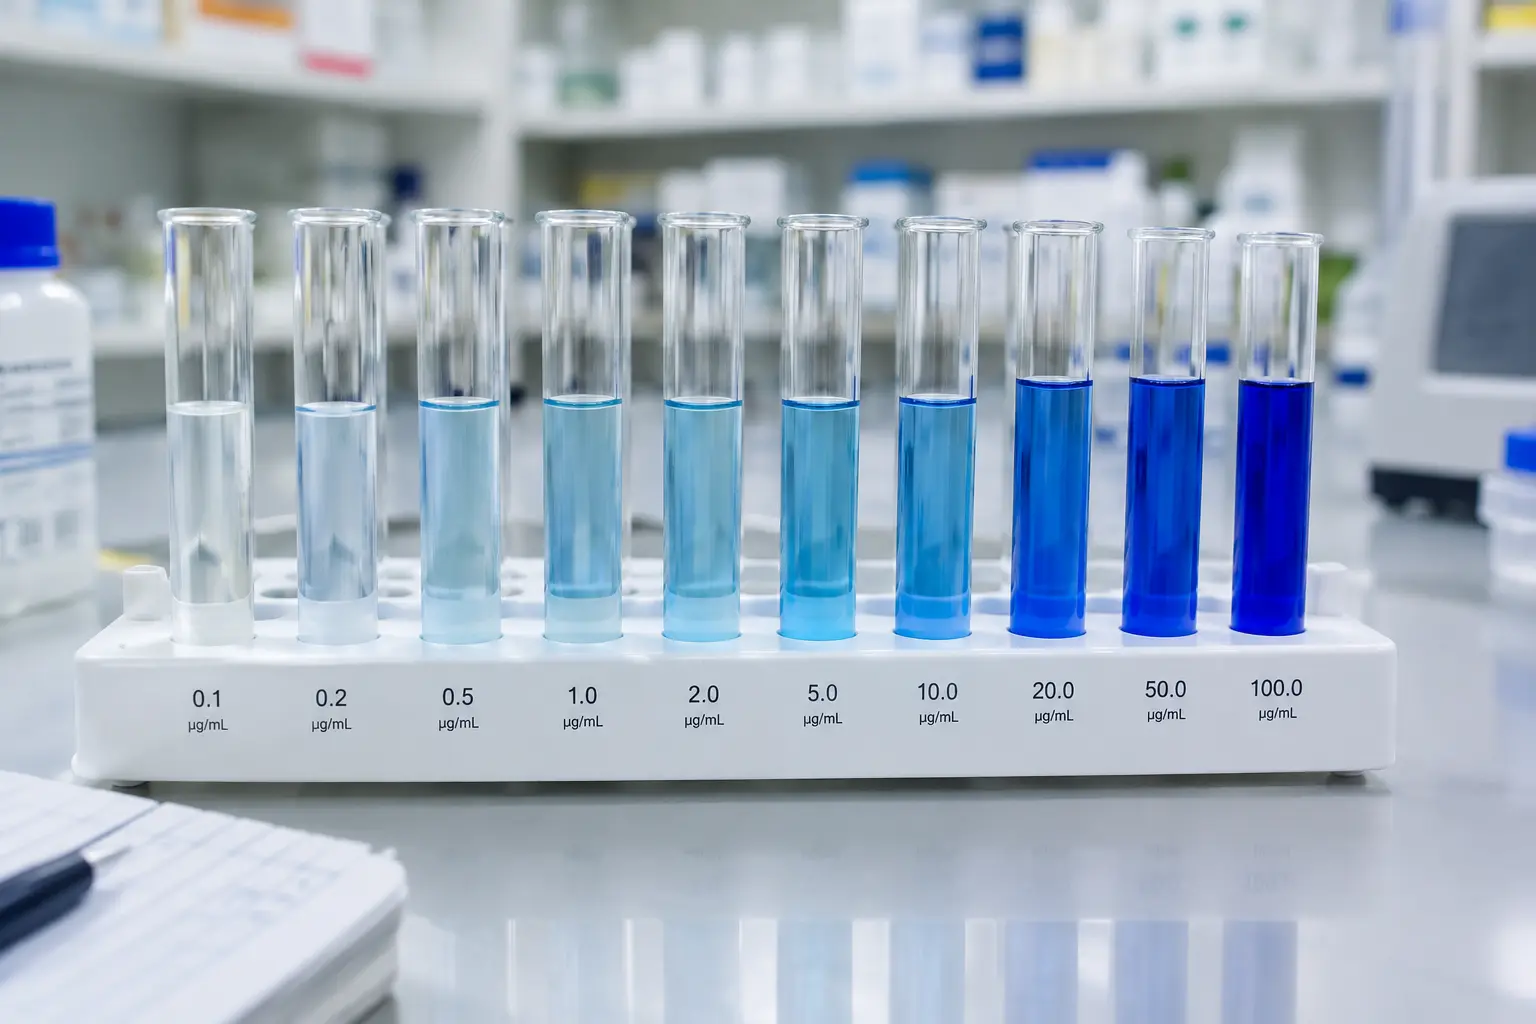
Most Nigerian undergraduate pharmacy projects are KAP surveys (knowledge, attitude and practice around a named medication class, a disease condition, or a professional practice), drug-utilisation reviews, or patient-satisfaction and adherence studies — all of which produce the same kind of data a business administration or nursing survey produces: categorical and Likert-scale responses analysed with descriptive statistics, chi-square tests of association, and group-comparison tests. SPSS handles all of this natively through its menus, without requiring you to write a single line of code, which is why it remains a standard teaching tool in many Nigerian pharmacy departments. Our general guide to analysing project data in SPSS covers the mechanics step by step once you have your dataset ready, and once you have your output, our guide to writing Chapter Four covers turning those tables into the finished chapter.
Why GraphPad Prism Fits Laboratory Pharmacology Data Specifically
If your project involves bench work — testing a compound’s effect across a range of concentrations, calculating a median effective or inhibitory concentration, comparing dose-response curves between two treatments — GraphPad Prism is purpose-built for this in a way SPSS is not. Its nonlinear regression tools fit standard pharmacological models (sigmoidal dose-response, one-phase and two-phase decay) with far less manual setup than replicating the same analysis in SPSS or Excel, and its graphing output is the style expected in pharmacology and pharmaceutical-sciences publications. GraphPad’s own site offers a free trial with no credit card required and lists separate student pricing, though the exact current price is not shown on the product page itself — confirm the figure on GraphPad’s own pricing page before budgeting for it, rather than relying on a number quoted anywhere else.
Why R Is the Free Alternative Worth Considering
R is a free, open-source statistical programming language capable of everything SPSS and GraphPad Prism do, plus considerably more advanced pharmacokinetic and pharmacometric modelling through dedicated packages, at no cost. The trade-off is real: R has no menus, and every analysis is written as a short script, which means a genuine learning investment under a deadline you may not have time for. If your department already teaches R, or you have used it in a statistics course, it removes cost entirely as a constraint on your analysis. If you have never used it before, budget real time to learn it, or treat it as a fallback if SPSS access becomes a problem rather than your first choice.
The Free Middle Ground: jamovi and JASP
If SPSS is unavailable and R’s learning curve is more than your deadline allows, jamovi and JASP are both free, open-source statistical packages built around the same menu-driven, point-and-click interface SPSS uses — you select a test from a menu and see results immediately, without writing code. Both handle the descriptive statistics, chi-square tests, t-tests and ANOVA that cover the large majority of survey-based pharmacy project designs, and both can import a spreadsheet of your data directly. They are worth knowing about specifically because they solve the exact gap between SPSS’s cost and R’s learning curve, at zero cost either way; confirm with your supervisor whether your department accepts output from software other than SPSS before committing to one, since some departments expect SPSS output format specifically in an appendix.
What About Excel?
Excel is a reasonable starting point for entering and organising raw data, and it can produce basic descriptive statistics and simple charts, but it is not built for the inferential tests (chi-square, t-tests, ANOVA, regression) that most pharmacy projects need to test a hypothesis, and building those manually in Excel is both more error-prone and more time-consuming than using dedicated software. Use Excel for data entry and a first look at your data, then move to SPSS, Prism, jamovi/JASP or R for the actual analysis your Chapter Four needs.
Matching the Tool to Your Specific Pharmacy Sub-Field
Clinical and social pharmacy projects (KAP studies, adherence research, pharmacovigilance surveys, pharmacy practice audits) fit SPSS, jamovi or JASP. Pharmaceutical chemistry, pharmacology and pharmaceutics projects involving laboratory assays, formulation testing or dose-response work fit GraphPad Prism. Pharmacognosy projects that combine a laboratory extraction or assay stage with a survey component (on traditional medicine use, for example) may need both: a survey tool for the survey data, Prism for the laboratory data, reported as two distinct analyses in Chapter Four rather than forced into one tool that does neither job well.
A Worked Illustrative Example
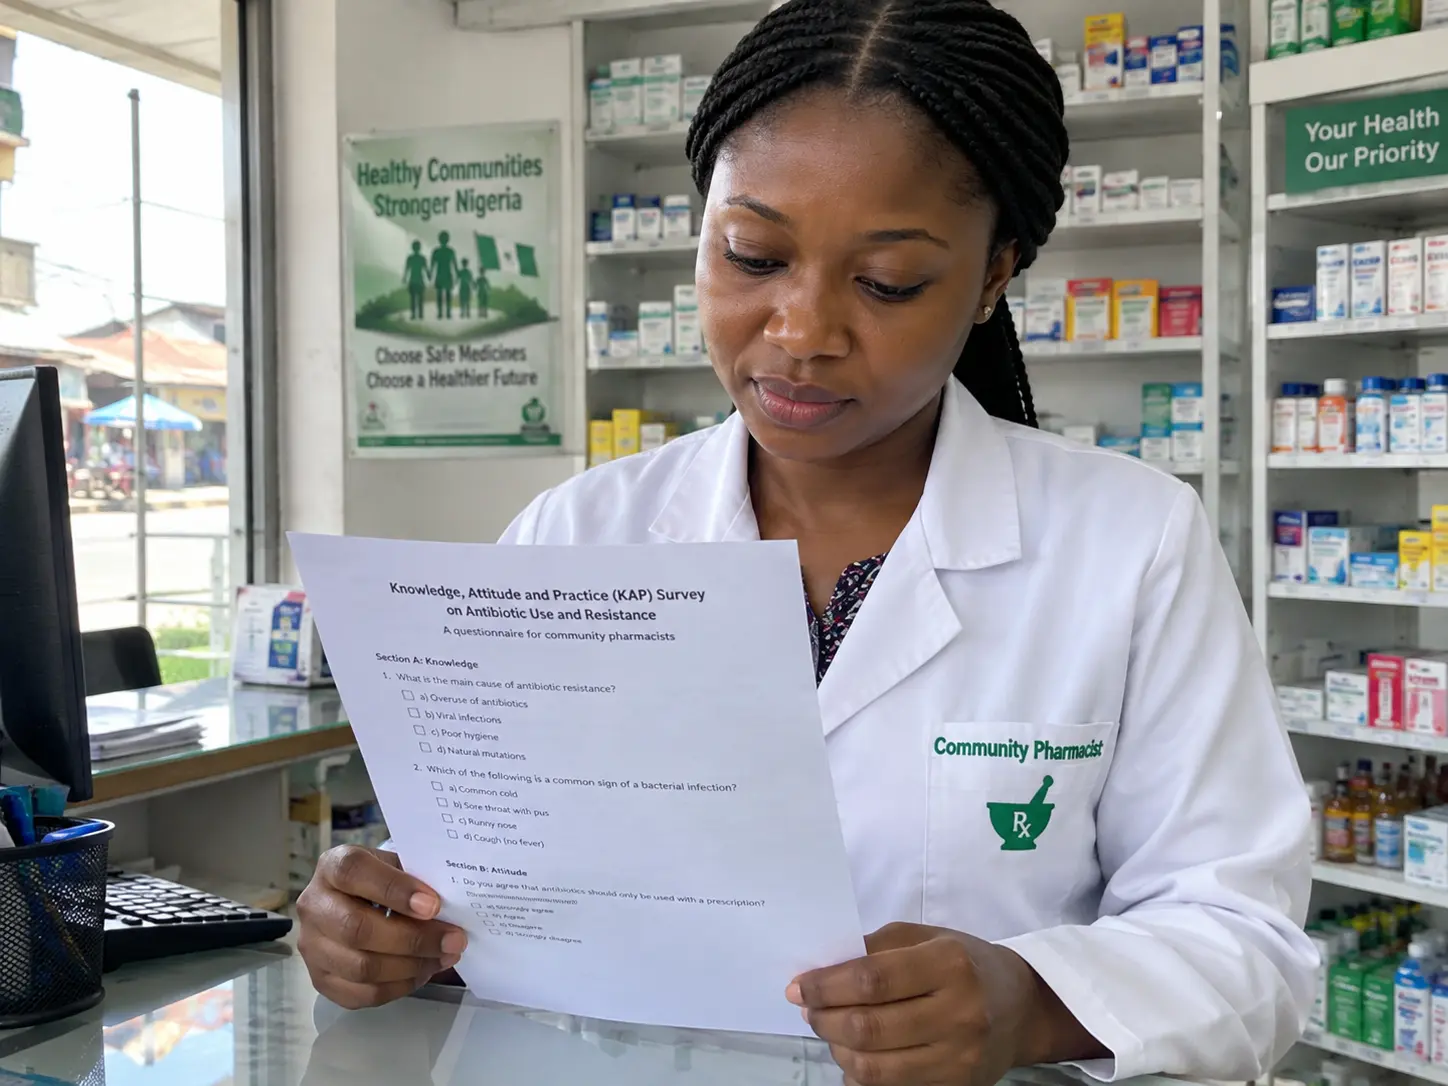
The following is a labelled, illustrative example, not a real study. A pharmacy student studying antibiotic dispensing practices among community pharmacists in a named LGA runs a 200-respondent KAP survey in SPSS: descriptive statistics answer the knowledge-level and attitude-level research questions, and a chi-square test of independence answers the hypothesis that years of practice experience are associated with adherence to dispensing guidelines. A second, unrelated pharmacy student testing a plant extract’s antimicrobial activity against a named bacterial strain runs a dose-response assay across six concentrations in triplicate, then uses GraphPad Prism’s nonlinear regression to fit a sigmoidal dose-response curve and calculate the IC50, reporting the curve itself as a figure in Chapter Four. Both projects report their method and software by name in Chapter Three, and neither borrows the other’s tool, because the tool follows the design, not the other way round.
Graphing Conventions Pharmacy Panels Expect
Whichever tool you use, a few graphing conventions are worth following regardless: label both axes with the variable and its unit, state the sample size on or beside the figure, use error bars where you have replicate data and state in the caption what they represent (standard deviation or standard error of the mean, not left ambiguous), and keep the same graphing style consistent across every figure in your results chapter rather than switching styles between figures. GraphPad Prism defaults to publication-style output that already follows most of these conventions; in SPSS, jamovi, JASP or Excel, these details need to be set deliberately, since the software’s own defaults do not always include them.
What to State in Chapter Three
Name the specific software and version you used, not just “statistical software was used for analysis” — a sentence such as “data were analysed using IBM SPSS Statistics, followed by the exact version number you ran, with descriptive statistics for research questions one and two and chi-square test of independence for hypothesis one at the 0.05 level of significance” ties your tool choice directly to your research questions and hypotheses, which is exactly what our guide to choosing the right statistical test recommends regardless of which software you ultimately run it in.
Once you have chosen your tool and run your analysis, Tesify helps you write up the results consistently in Chapter Four and keeps the method you named in Chapter Three aligned with what actually appears in your tables. Start your pharmacy project with Tesify — over 9,000 students and 15,000+ chapters written, 100% written by you.
Frequently asked questions
Does my pharmacy department require a specific statistical software?
Many Nigerian pharmacy departments teach and expect SPSS by default for survey-based projects, but this varies by institution and by your specific project type; confirm with your supervisor before committing time to learning a different tool.
Can I use GraphPad Prism for a KAP survey project?
It can handle basic descriptive statistics and simple group comparisons, but SPSS is generally the more natural fit for survey data with many categorical and Likert-scale variables, since Prism’s strengths lie in dose-response and curve-fitting analysis rather than large survey datasets.
Is R too advanced for an undergraduate pharmacy project?
Not inherently, but it requires writing code rather than using menus, which is a genuine time investment if you have not used it before. It is a strong choice if you already know it or have time to learn it, and a free fallback if cost is your main constraint.
How do I calculate an EC50 or IC50 value for my project?
GraphPad Prism’s built-in nonlinear regression models are designed specifically for this calculation from a dose-response dataset; consult your laboratory supervisor for the specific model that fits your assay design before running the analysis.
Is a free trial of GraphPad Prism enough to complete my project?
Trial length and terms are set by the vendor and confirmed on GraphPad’s own site rather than quoted here, since they can change; check the current trial terms directly before relying on it to cover your entire data-analysis period.
Can I switch from SPSS to R partway through my project?
You can, though re-running an existing analysis in a new tool takes time and you should confirm your results match before reporting them, since different software can handle certain edge cases (missing data treatment, rounding) slightly differently.
What if my department does not have an SPSS licence available to students?
Ask whether your department or faculty offers a limited-access student licence or computer lab installation; if none is available, jamovi or JASP replicate SPSS’s menu-driven workflow at zero cost, and R is a more advanced free alternative if you have time to learn it.
Do I need to report the software version I used?
Stating the specific version (for example, “SPSS Statistics version 29”) in Chapter Three is good practice, since some features and default outputs have changed between versions, and it removes any ambiguity if a panel asks about a specific output.
How many replicates do I need for a dose-response assay?
Triplicate (three replicates per concentration) is the common minimum convention in pharmacology laboratory work to allow a meaningful error estimate, though your specific protocol and supervisor’s requirement should be confirmed before you run the assay, since some designs call for more.