Tag: 2026

  • Transcribing and Coding Interview Data for a Nigerian Project: The Tools Compared (2026)

    Transcribing and Coding Interview Data for a Nigerian Project: The Tools Compared (2026)

    If your project rests on interviews or focus group discussions, two jobs stand between the recordings on your phone and Chapter Four: turning speech into text, and turning text into themes. Different tools do each, the free tiers are smaller than students expect, and one Nigerian decision — which language the transcript is in — has to be recorded in Chapter Three whichever tool you use.

    The comparison, before anything else

    Tool Job Cost Runs offline The catch for a Nigerian project
    Otter.ai (Basic) Automatic transcription Free No 3 lifetime audio/video file imports and 300 transcription minutes a month. Three files is fewer than any interview set.
    Otter.ai (Pro) Automatic transcription $16.99 per user per month, listed No 10 file imports a month. Priced in dollars, needs a card that works.
    Whisper (OpenAI, open source) Automatic transcription and speech translation Free, MIT licence Yes — it runs on your machine Needs Python and PyTorch installed, and a laptop with enough memory for the model size you pick.
    Typing it yourself Transcription Free Yes Slow, and the slowness is partly the point — you hear your own data.
    QualCoder Coding Free, open source Yes Codes audio and video directly, so a full transcript is not always required. Setup takes an afternoon.
    Taguette Coding Free, BSD licence Yes (installed locally) Documents only. Local install is offline and single-user; the hosted version allows collaboration but needs a connection.
    NVivo Coding Paid. Student licence = 12 months, one named user Yes No price is readable on the product page. Ask your librarian whether your university already holds a licence.
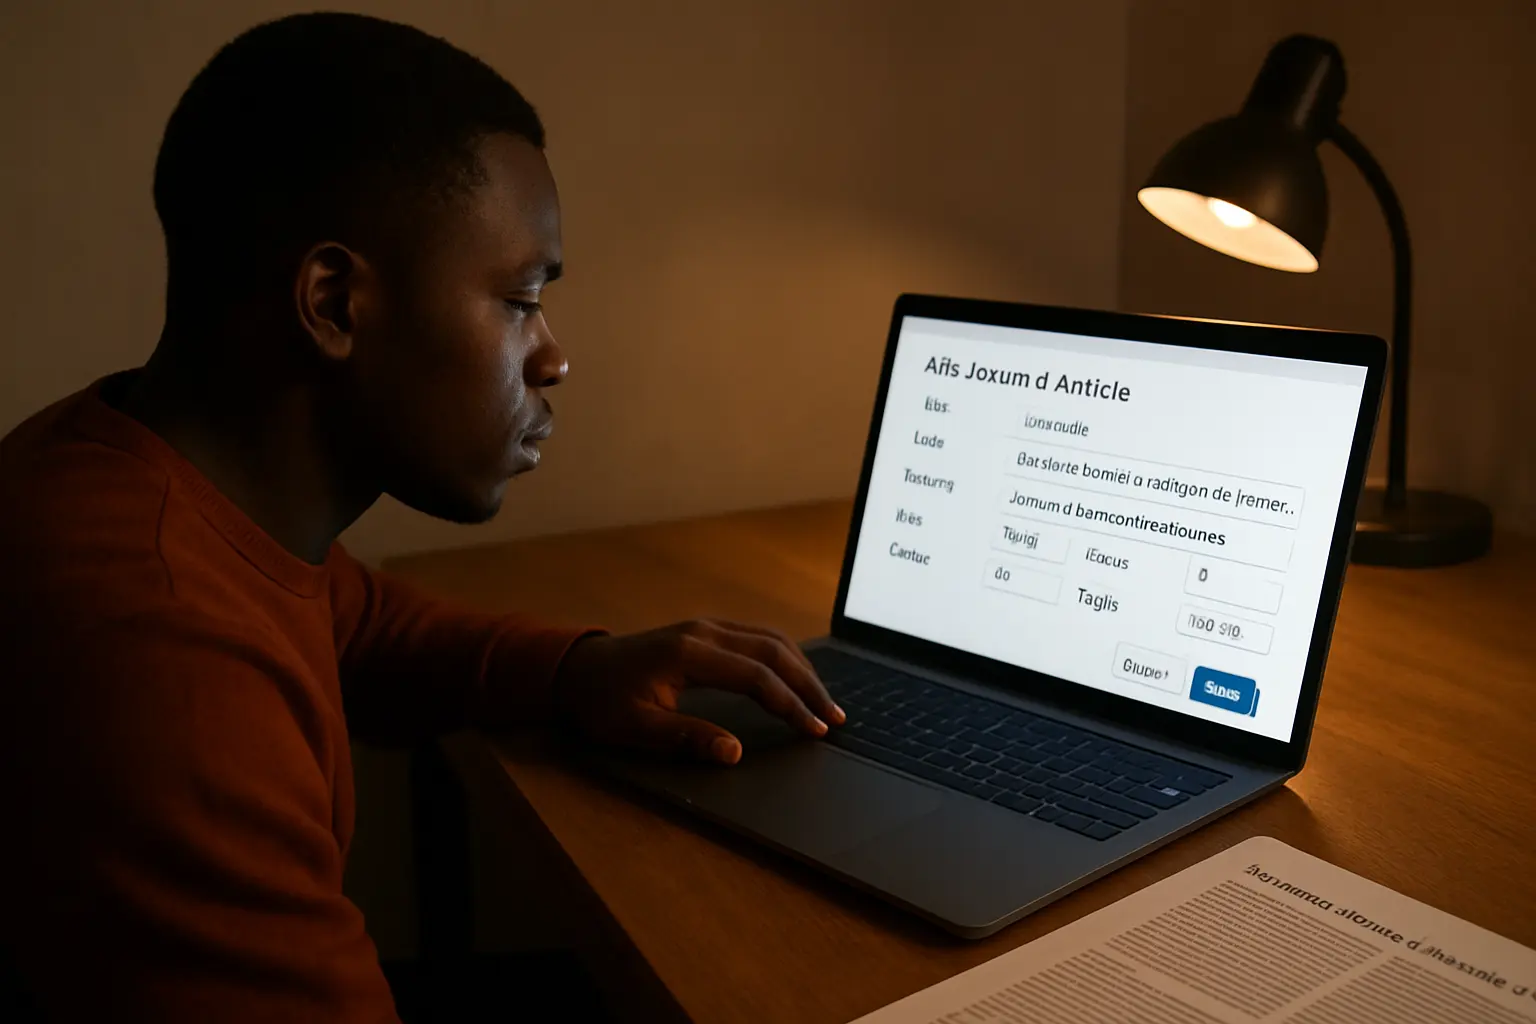
    A student with headphones transcribing an interview recording into a document beside an audio waveform
    Transcription is the expensive step. Decide how you will do it before the twelfth recording, not after.

    Step one: decide what language the transcript is in, and write it down

    This is the decision that separates a Nigerian qualitative project from a textbook one, and no software will make it for you.

    If your interviews were conducted entirely in English, skip this section. If any of them ran in Pidgin, Hausa, Yoruba, Igbo or a mix — which is normal, and often the reason your respondents spoke freely at all — then you have three choices and Chapter Three must say which you took:

    1. Transcribe verbatim in the language spoken, then translate to English for analysis. The most defensible option, and the one that lets you quote the original alongside the translation.
    2. Translate directly while transcribing. Faster and common, but you are making interpretive decisions with no record of them, and a panellist can ask what a specific phrase was in the original.
    3. Analyse in the original language and translate only the quotes you use. Strongest when you are fluent and your supervisor is too.

    Whichever you pick, record three things in your methodology: who did the translation, whether anyone checked it, and whether quotes appear in the original alongside the English. A second person back-translating even two transcripts is a cheap validity claim, and it is the kind of detail the Chapter Three guide expects in the data analysis section.

    The practical consequence for tool choice is blunt: automatic transcription is built and benchmarked mostly on English, and none of these projects publishes accuracy figures for Nigerian languages or heavily accented Nigerian English. Do not assume, and do not take a vendor’s word for it. Feed one tool five minutes of your actual audio and read the output. If you spend longer correcting than you would have spent typing, you have your answer.
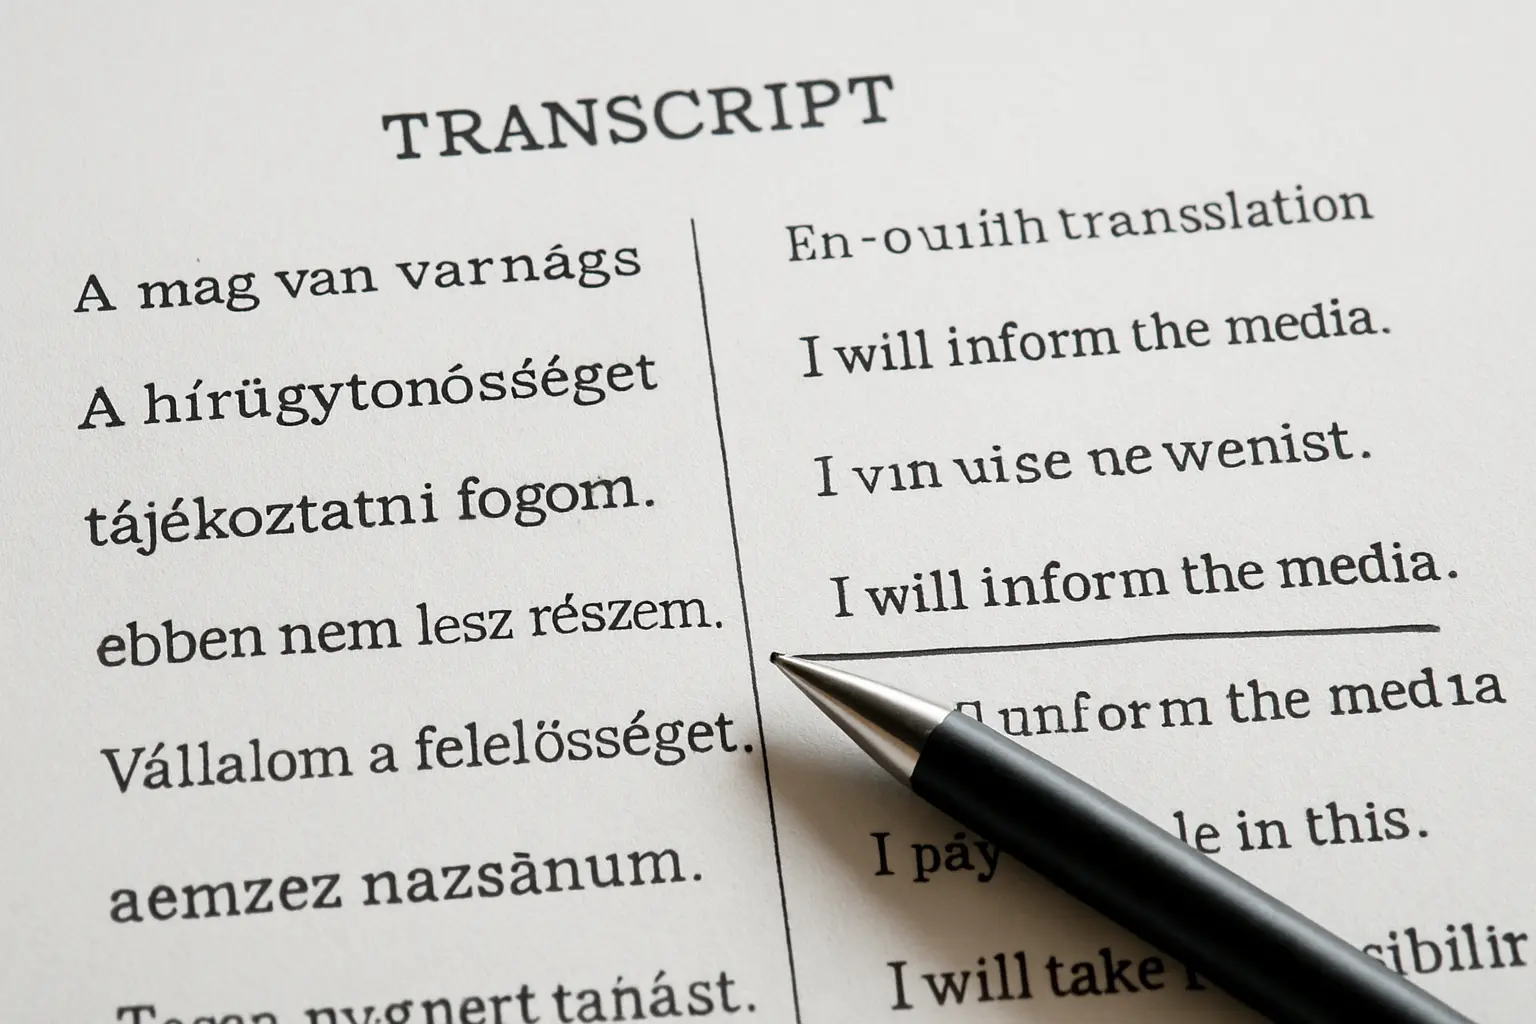
    A transcript page with the original spoken words in one column and the English translation in the other
    A parallel transcript costs an extra column and answers the question “what did she actually say?” in one move.

    Step two: transcription, ranked

    1. Whisper — free, offline, and the only automatic option that does not meter you

    Whisper is OpenAI’s open-source speech recognition model, released under the MIT licence. Its documentation describes it as a general-purpose, multitasking model performing multilingual speech recognition, speech translation and language identification — the translation capability is unusual and directly relevant if your recordings are not in English.

    It runs on your own machine, which means no upload limits, no monthly minutes, and your respondents’ recordings never leave your laptop — a real consideration when the recordings contain identifiable people. The cost is setup: it needs Python and PyTorch, and there are six model sizes trading speed against accuracy, so a modest laptop should start with a smaller model. Budget an afternoon for installation and test on a short clip first.

    2. Typing it yourself — still the right answer for a small set

    For eight to twelve interviews, manual transcription is entirely reasonable and it has one advantage no tool gives you: you hear where you interrupted, where you led the respondent, and where the interesting answer was buried under a follow-up question you should not have asked. Transcribe your first two interviews by hand whatever you do afterwards, because those two will improve every interview that follows.

    3. Otter.ai — check the limit before you rely on it

    Otter’s free Basic plan lists three lifetime audio and video file imports and 300 transcription minutes a month. Three lifetime imports is not a research project; it is a trial. The Pro plan is listed at $16.99 per user per month with ten file imports a month. If you are going to pay in dollars, price it against the number of recordings you actually have before subscribing, and remember it is a cloud service, so uploading requires both a connection and a decision about sending respondent recordings to a third party.

    Step three: coding, ranked

    1. QualCoder — the pick if you have recordings

    QualCoder is free and open source, and it imports text from txt, odt, docx, html, md, epub, rtf and PDF — but the reason to choose it here is that images, video and audio can also be imported for coding. You can attach codes to selections inside the recording itself, which means a full verbatim transcript stops being a prerequisite for starting analysis.

    Codes group into categories in a hierarchy, which matters once you pass about twenty tags, and its reports include coding frequencies, visual coding graphs and a coder comparison — useful if two group members code the same transcript and you want to show the panel how closely you agreed.

    Expect friction installing on Windows: the project states plainly that the executable triggers an “unknown publisher” warning because a trusted publisher certificate is expensive and it has not bought one. Audio and video coding also wants VLC installed.

    One caution. QualCoder can connect to external AI models to explore your data. Before enabling that, check your department’s rule on sending research material to a third-party service — the boundary is set out in whether you can use AI on a final year project. Coding is exactly the stage where an unexamined machine suggestion becomes a theme you cannot defend.

    2. Taguette — the simplest thing that works, if your data is text

    Taguette is free under the BSD licence and its own FAQ states that it costs nothing whether you run it on your machine or install it on a server. You import documents, highlight passages, attach tags, and export your project, your codebook, all your highlighted quotes, the quotes for a single tag, or the highlighted documents. It converts files through Calibre, so DOCX, ODT, PDF, TXT and HTML all open.

    The trade-off is explicit in its documentation: running locally means you work offline and by yourself; using the hosted server means you can collaborate. Pick offline unless your group genuinely needs simultaneous access. If you cite it, the project asks for Rampin et al. (2021), Journal of Open Source Software, 6(68), 3522.

    3. NVivo — only if your university already pays for it

    NVivo is the name you will see in published methodology sections. Lumivero states that student licences give twelve months of unrestricted access for one named user. No price is published on the product page, and the pricing pages for NVivo and ATLAS.ti did not resolve when we checked in August 2026, so we will not quote a naira figure. Ask your college librarian or research office whether a site licence exists; if it does, it is free to you and worth using.
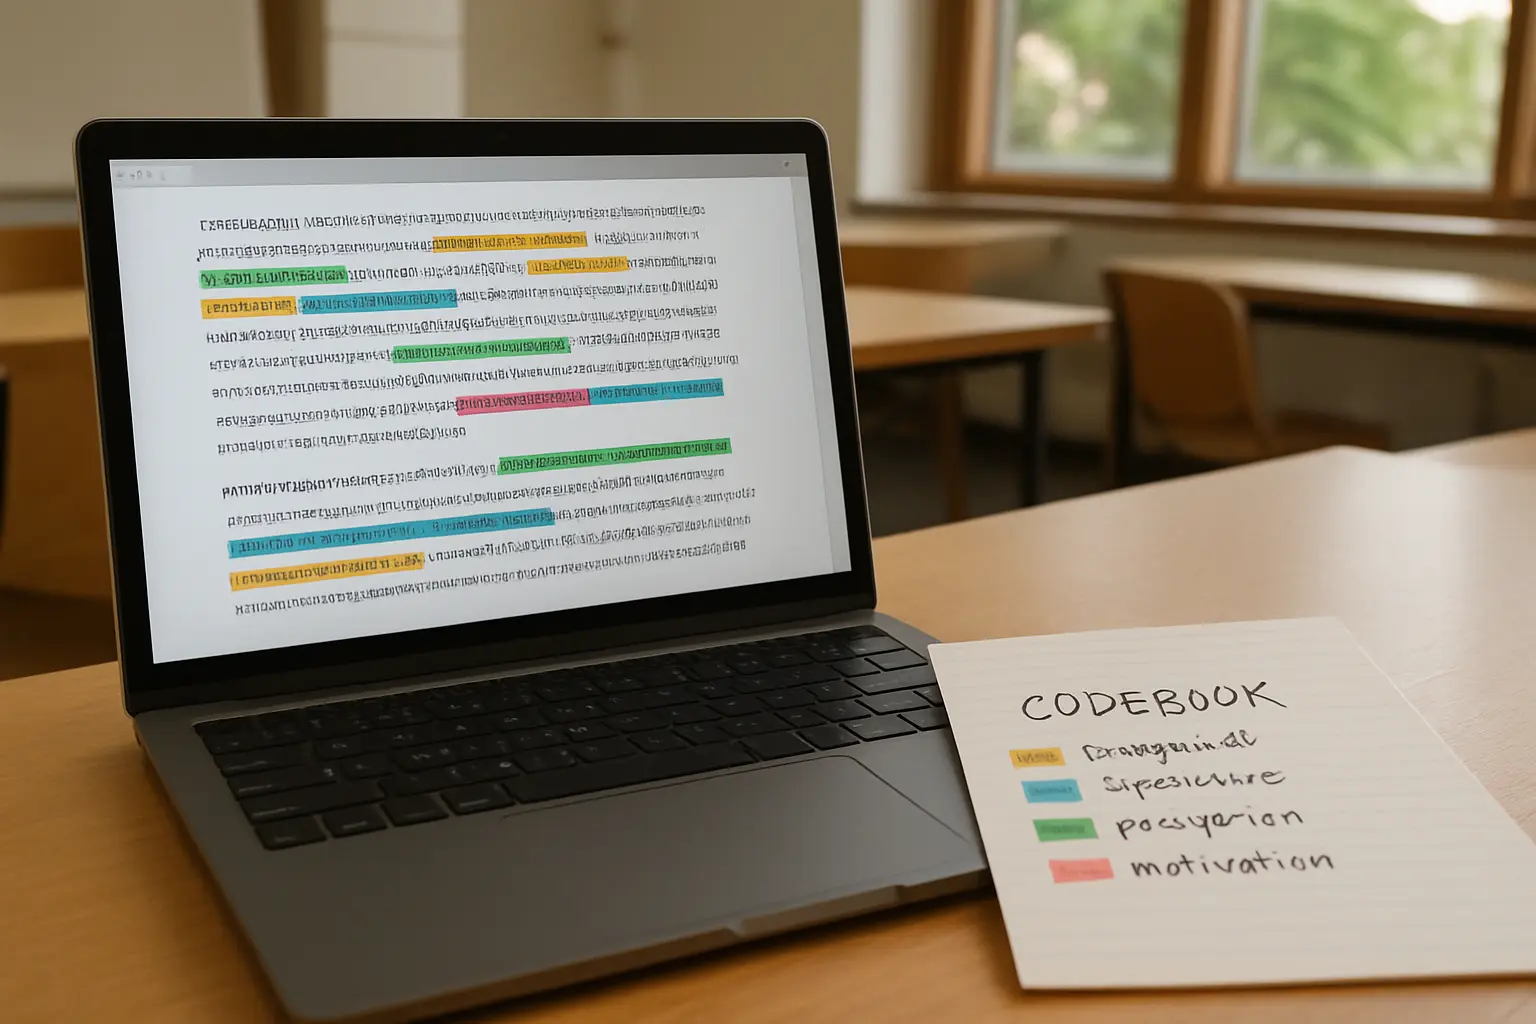
    Coloured tags applied to passages of a transcript on a laptop beside a handwritten codebook of tag names
    Whatever the tool, the deliverable is the same: a codebook your panel can read as an appendix.

    The recommendation

    Transcribe your first two interviews by hand, then run the rest through Whisper on your own laptop, and code in QualCoder. That combination is free end to end, works with no connection, keeps respondent recordings on your machine, and lets you code audio directly for anything you never fully transcribe.

    Runner-up, for a tighter budget of time rather than money: type the transcripts yourself and code in Taguette. Taguette installs in minutes where QualCoder takes an afternoon, and for a text-only study with a dozen transcripts it does everything you need.

    Decide before you start coding. None of these formats reads another, so switching halfway is a manual retyping job.

    What none of them does for you

    Deciding how many participants was enough. A tool counts what you collected; it does not tell you when to stop. That argument, and how to defend a sample you did not calculate with a formula, is in how many respondents a qualitative project needs.

    Turning tags into themes. A tag labels a passage; a theme is a claim supported by several tags. A frequency count tells you which label you used most, not which one means something.

    Writing the chapter. Your themes still have to be presented in the order of your research questions, with quotes as evidence, the same discipline the numbers version follows in writing Chapter Four — and they still have to become one conclusion per research question in Chapter Five.

    Naming the software in your methodology. Name it with its version, exactly as a quantitative project names its statistical package. If your study mixes methods and also needs a test, that choice is a separate one — see what statistical test to use and the step-by-step in analysing project data in SPSS.

    The themes are yours. The chapter around them does not have to be.

    Tesify keeps your methodology, your themes and your conclusions in one connected document, so the codebook you exported has somewhere to land and Chapter Three already names the procedure you actually followed. Start on the free plan, alongside 9,000+ students and 15,000+ chapters — every word still written by you.

    Build your qualitative chapters in Tesify

    Frequently asked questions

    What is the best software for analysing qualitative project data?

    QualCoder if you have audio or video, Taguette if your data is text only. Both are free, open source and run offline on Windows, macOS and Linux, and both export a codebook you can attach as an appendix.

    Is there a free alternative to NVivo?

    Yes. Taguette and QualCoder both do the core job — tag passages and retrieve them by tag — at no cost. What you give up is polish and support, not the ability to run a defensible thematic analysis.

    How many free transcriptions does Otter give you?

    The Basic plan lists three lifetime audio or video file imports and 300 transcription minutes a month. For a project with a dozen recordings that is a trial, not a workflow.

    Can I transcribe for free without uploading my recordings?

    Yes. Whisper is released under the MIT licence and runs on your own machine, so nothing is uploaded. It needs Python and PyTorch and offers six model sizes trading speed against accuracy.

    Will automatic transcription handle Pidgin, Hausa, Yoruba or Igbo?

    Do not assume it will. These tools describe themselves as multilingual, but none publishes accuracy figures for Nigerian languages or strongly accented Nigerian English. Test on five minutes of your own audio and count the corrections before committing your whole dataset.

    Do I have to transcribe every interview in full?

    Not necessarily. QualCoder lets you code audio and video selections directly, so a full verbatim transcript is not always a prerequisite. You will still need verbatim text for any quote you print in Chapter Four.

    Do I need to say in Chapter Three that I used software?

    Yes. Name the tool and its version in the data analysis section, alongside your coding approach and how the themes were validated, exactly as you would name SPSS.

    What if my interviews were in a Nigerian language?

    Decide whether you transcribe verbatim then translate, translate as you transcribe, or analyse in the original and translate only quotes. Then record who translated, whether anyone checked, and whether the original appears beside the English.

    Can my whole group code together?

    Not simultaneously on a locally installed tool. Nominate one custodian of the project file. QualCoder does support comparing two coders inside one project, which is the more useful thing to show a panel anyway.

    Will free software weaken my defence?

    No. Panels ask what your coding procedure was and how the themes were validated, not which brand produced them. A clear codebook in the appendix answers that better than a tool name — the question patterns are in what panels ask at a project defence.

    Which AI tools are safe to use alongside this?

    Whatever your department permits, used on your own words rather than in place of them. The category-by-category comparison is in the best AI tools for a final year project.


  • How Much Is Your Final Year Project Worth? Credit Units, Grading and Your CGPA (2026)

    How Much Is Your Final Year Project Worth? Credit Units, Grading and Your CGPA (2026)

    There is no national mark scheme for a Nigerian final year project. What the National Universities Commission does fix is the number of credit units your project carries — and that number is 3, 4 or 6 depending on your programme, written into the NUC’s own curriculum document. Once you know it, the effect on your CGPA is arithmetic: a 6-unit project can move a 120-unit degree by up to 0.25 grade points, which is more than the width of some class boundaries.

    What the NUC actually fixes

    The Core Curriculum and Minimum Academic Standards (CCMAS), published by the National Universities Commission and downloadable per discipline from its website, sets three things that bear directly on your project mark.

    First, the grade point scale. All courses are graded out of 100 and converted as follows:

    Mark % Letter grade Grade point
    70 – 100 A 5
    60 – 69 B 4
    50 – 59 C 3
    45 – 49 D 2
    40 – 44 E 1
    0 – 39 F 0

    Source: NUC CCMAS, Social Sciences discipline, Table 1.2.

    Second, the class of degree. Your cumulative grade point average maps to a class:

    CGPA Class of degree
    4.50 – 5.00 First Class Honours
    3.50 – 4.49 Second Class Honours (Upper Division)
    2.40 – 3.49 Second Class Honours (Lower Division)
    1.50 – 2.39 Third Class Honours
    1.00 – 1.49 Pass

    Source: NUC CCMAS, Social Sciences discipline, Table 1.4.

    Third, the size of the degree. The minimum for the award of a degree is 120 credit units for UTME entrants and 90 for direct entry. Every course counts: the CCMAS states that grades in all courses, “whether compulsory or optional and whether passed or failed”, must be included in the computation, and that where a course is repeated, the grades at each and all attempts are included.

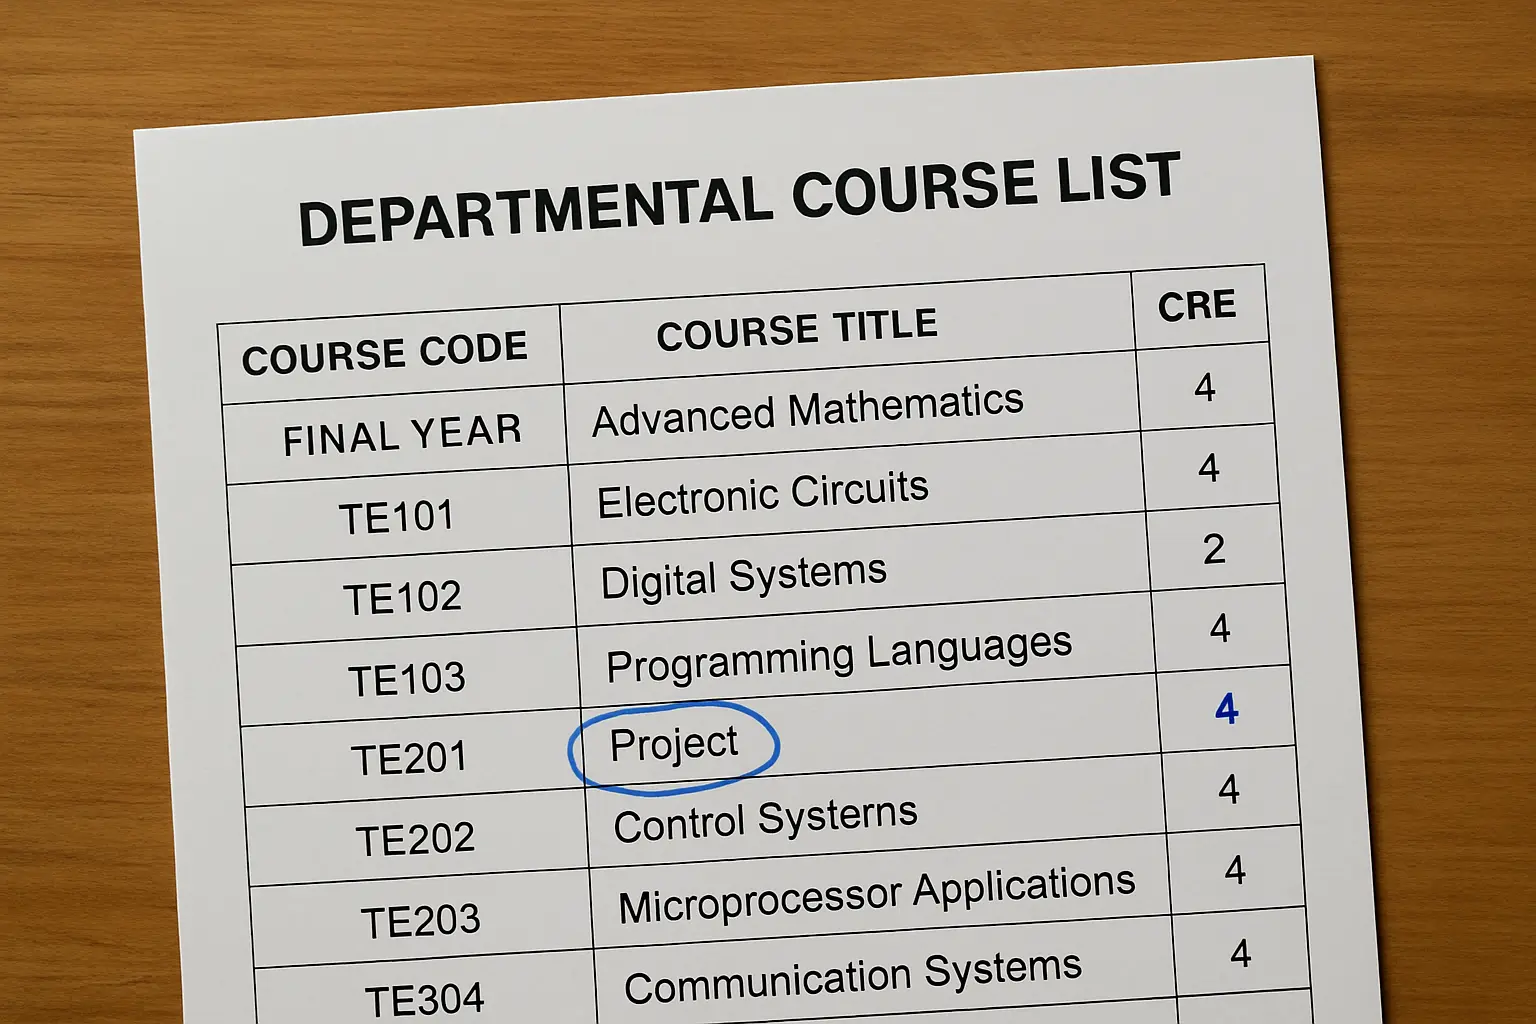
    A Nigerian student calculating the effect of a project grade on a CGPA beside a departmental course list
    Your project’s weight is not a rumour. It is printed in the course code line of your programme’s national curriculum.

    How many units is your project worth?

    This is the question that decides everything else, and it has no single answer — not because nobody knows, but because the NUC deliberately sets it per programme. Within the Social Sciences discipline alone, the CCMAS assigns:

    Programme Course code Units Practical hours
    Sociology SOC 408 Research Project 6 270
    Economics ECO 499 Research Project / Original Essay 6 270
    Social Work SWK 402 Research Project 6 270
    Demography and Social Statistics DES 401 Research Project 6 270
    Political Science POL 407 Research Project 4 180
    Psychology PSY 406 Research Project 4 180
    Criminology and Security Studies CSS 401 Research Project 4 180
    Philosophy, Politics and Economics PPE 499 Long Essay 4 180

    Computing is structured differently again. The CCMAS splits it into two separate 3-unit courses across two semesters — CSC 497 Final Year Project I and CSC 498 Final Year Project II, at 135 practical hours each — and the same 3 + 3 pattern is used for Cybersecurity (CYB 497/498), Data Science (DTS 497/498) and Information and Communication Technology (ICT 497/498). If you are in one of those programmes you receive two project grades, in two different semesters, and a weak first half is still recoverable in the second.

    So the honest answer to “how many units is a final year project in Nigeria” is: look up your own programme. Your departmental course list carries the code and the unit figure on the same line, and the national document behind it is free to download.

    What do the practical hours mean?

    The CCMAS defines a credit precisely: “One credit is equivalent to one hour per week per semester of 15 weeks of lectures or three hours of laboratory/studio/workshop work per week per semester of 15 weeks.”

    A project is counted in the second category, which is why a 6-unit project is listed at 270 hours — 6 units × 3 hours × 15 weeks. That figure is not a target anybody polices, but it is a useful sanity check on your own planning. 270 hours is roughly eighteen hours a week across a fifteen-week semester. Students who budget two weekends for the whole project are not being lazy so much as working from a wrong estimate of what the curriculum assumes.

    The arithmetic: how much does the project actually move your CGPA?

    Take a student on a 120-unit degree with a 6-unit project, whose other 114 units have averaged a CGPA of 3.45 — just under the Second Class Upper boundary of 3.50.

    Project grade Grade point Final CGPA Class
    A (70–100) 5 3.53 Second Class Upper
    B (60–69) 4 3.48 Second Class Lower
    C (50–59) 3 3.43 Second Class Lower
    D (45–49) 2 3.38 Second Class Lower
    E (40–44) 1 3.33 Second Class Lower

    Computed as (114 × 3.45 + 6 × grade point) ÷ 120.

    For that student the project is the whole difference between a 2:1 and a 2:2, and an A rather than a B is what does it. That is the strongest honest case for taking it seriously — not that the project decides your degree in general, but that it lands last, when your CGPA is already close to a boundary and nothing else is left to move it.

    The maximum swing, in general terms:

    Project size Degree size A instead of C A instead of E
    6 units 120 units (UTME) +0.10 +0.20
    4 units 120 units (UTME) +0.07 +0.13
    6 units 90 units (direct entry) +0.13 +0.27
    4 units 90 units (direct entry) +0.09 +0.18

    Two things fall out of this table. Direct entry students carry more risk and more upside, because the same project is a larger share of a 90-unit degree. And if you carried more than the minimum number of units, the effect is proportionally smaller than the figures above — use your own total, not 120, if you know it.

    A departmental course list with the project course code and its credit unit figure circled in pen
    The unit figure sits on the same line as the course code. Find it before you decide how much of the semester the project deserves.

    What the CCMAS does not say — and why that matters

    We read the curriculum documents looking for a national rule on how a project’s 100 marks are divided between the supervisor and the defence panel. There is none. The CCMAS fixes credit units, the grade point scale and the degree classification, but it does not prescribe an internal mark breakdown for a project, and it does not set a national pass mark for the defence separately from the course.

    That matters because a confident split — “60% supervisor, 40% panel” — circulates widely online and is presented as a national standard. It is not one. It may well be your department’s rule, and if it is, your department’s rule governs you. But it is a departmental decision, and the only way to know yours is to read your project handbook or ask your supervisor. This is the same pattern documented for similarity thresholds in the guide to acceptable plagiarism percentages in Nigerian universities: a number invented by content farms, repeated until it sounds official, and contradicted by the institutional documents themselves.

    One thing the CCMAS does state is that external examiners from other universities are “a crucial quality assurance requirement for all courses in Nigerian University System”, and that their role should go beyond moderating questions to examining scope and depth against curricular expectations. In practice this is why a final year project is frequently seen by someone who has never met you — and why the internal politics of your supervisor relationship matter less to the mark than students assume.

    Nigerian students reading a departmental results notice board showing grades and classes of degree
    The mark becomes a grade point, the grade point becomes a class. Everything upstream of that is departmental.

    So what actually earns the marks?

    Since the breakdown is departmental, the reliable guide is what panels test, and that is consistent across Nigerian departments even where the mark schemes differ.

    1. Internal consistency. The number of research questions in Chapter One, the number of tables in Chapter Four and the number of conclusions in Chapter Five should match in number and order. This costs nothing to fix and is checked first.
    2. One respondent count everywhere. The sample size in Chapter Three, the analysed N in your tables and the figure in your abstract must agree.
    3. A method you can justify. Naming the tool is not enough; you have to say which research question it answers, as set out in choosing the statistical test for your project.
    4. Sources that are real and correctly formatted, in the style your department mandates — see how to reference the way your university requires.
    5. Being able to speak to your own work. The question bank is in what is asked during a project defence, and a student who cannot discuss their own methodology loses marks no formatting can recover.

    Notice what is absent from that list: length, binding quality, and the number of references. Those are the three things students optimise hardest and the three that move a mark least.

    Where to find your own numbers, in ten minutes

    1. Your project’s units. Open your departmental course list for the final year and find the project course code. The unit figure is on the same line.
    2. Your national curriculum. Download your discipline’s CCMAS document free from the NUC website and search it for your course code. It gives the units, the practical hours and the official course description.
    3. Your current CGPA and total units. From your transcript or student portal.
    4. Do the arithmetic. Multiply your units-so-far by your current CGPA, add (project units × the grade point you are aiming at), and divide by your expected total units.
    5. Your department’s mark breakdown. Ask, because it is not published nationally.

    If step four puts you within about a tenth of a class boundary, you now know exactly how much the next few weeks are worth, which is a better basis for planning than anxiety. The five-chapter structure those weeks have to fill is itself a departmental convention rather than a national rule, and the CCMAS confirms this indirectly: Social Work’s course description is one of the few that spells the five chapters out explicitly, which tells you the others leave it to the department.

    The units are fixed. The grade is not.

    Tesify keeps your chapters in the structure your department expects and holds your research questions, tables and conclusions in one connected document — so the alignment a panel checks first is something you can see rather than rebuild by hand the night before. Start on the free plan, alongside 9,000+ students and 15,000+ chapters, with every word still written by you.

    Start your project in Tesify

    Frequently asked questions

    How is a final year project graded in Nigeria?

    It is graded out of 100 like any other course and converted to a grade point on the NUC’s five-point scale, where 70–100 is an A worth 5 points. It then enters your CGPA weighted by its credit units. How the 100 marks are split between your supervisor and the defence panel is set by your department, not nationally.

    How many credit units is a final year project?

    Three, four or six, depending on your programme. The NUC CCMAS assigns 6 units to Sociology, Economics, Social Work and Demography, 4 units to Political Science, Psychology and Criminology, and splits Computing programmes into two 3-unit courses across two semesters. Check your own departmental course list.

    Does the final year project affect your CGPA?

    Yes, in proportion to its units. On a 120-unit degree a 6-unit project scoring an A rather than a C raises your CGPA by 0.10, and an A rather than an E raises it by 0.20. That is frequently enough to cross a class boundary, because the project is marked last.

    What CGPA do you need for a 2:1 in Nigeria?

    3.50 on the five-point scale. The NUC classification runs 4.50–5.00 First Class, 3.50–4.49 Second Class Upper, 2.40–3.49 Second Class Lower, 1.50–2.39 Third Class and 1.00–1.49 Pass.

    Can a good project raise my class of degree?

    Only if you are already close to the boundary. A 6-unit project cannot move a 120-unit CGPA by more than 0.25 even in the extreme case, so it decides borderline cases rather than transforming a mid-range result. Whether you are borderline is something you can calculate exactly rather than guess.

    Is the project mark split between the supervisor and the panel?

    Usually, but the split is departmental. There is no national rule in the NUC’s curriculum documents, so any specific percentage you read online is somebody’s departmental practice presented as a standard. Ask your supervisor for yours.

    What is a good mark for a final year project?

    Seventy or above earns an A and the full 5 grade points, and that threshold is national. Below 40 is a fail and scores zero points, which still enters your CGPA.

    Do direct entry students’ projects count more?

    Proportionally, yes. The minimum for a direct entry degree is 90 units rather than 120, so the same 6-unit project is a larger share of the total and can move the CGPA by up to about 0.27 instead of 0.20.

    What happens if I fail my project?

    It scores zero grade points and, being a compulsory course, must be passed for the degree to be awarded — the CCMAS requires all compulsory courses to be completed and passed. The failed attempt also stays in the CGPA computation alongside the repeat, because grades at each and all attempts are included.

    Where can I find the official curriculum for my programme?

    The NUC publishes the CCMAS by discipline on its website as free PDF downloads, one document per discipline. Search yours for your project’s course code to see the units, the practical hours and the official course description.

    Does the length of my project affect the mark?

    Not directly, and no national rule sets a page count. Panels examine alignment, method and whether you can defend the work. A long project that contradicts itself scores below a short one that does not.

    Do the practical hours mean I have to log my time?

    No. The 270 or 180 hours is how the curriculum converts credit units into workload, not a record anybody collects. Treat it as an estimate of what the project is expected to take — roughly eighteen hours a week over a semester for a 6-unit project.

  • Your Supervisor Has Rejected Your Project Topic Twice. Here Is How to Get One Approved This Week

    Your Supervisor Has Rejected Your Project Topic Twice. Here Is How to Get One Approved This Week

    Two topics submitted, two rejections, no explanation longer than a sentence, and the department’s approval deadline is this week. Meanwhile your coursemates already have supervisors assigned and have started Chapter One, and every week you lose here is a week gone from the far end of the project — the analysis and the corrections, where time actually runs out.

    Here is the thing nobody tells you: topics are almost never rejected for being uninteresting. They are rejected for a small number of structural faults, and each one has a specific fix. Once you can name which fault yours has, the third submission is usually the last.

    Turn an approved topic straight into Chapter One with Tesify

    The five faults, and what each one sounds like

    Supervisors are busy and their feedback is compressed. A one-line comment usually maps to one of these.

    What they said The actual fault The fix
    “Too broad.” / “Narrow it down.” No bounded population or location Add a specific population, a named institution or organisation, and a period
    “Not feasible.” / “How will you get the data?” Respondents you cannot actually reach in one session Switch to a population you have access to, and say how
    “This has been done.” / “Check the department.” An existing project in the same department Change the population, the variable or the context — not the wording
    “What are you measuring?” Variables that cannot be operationalised Name the variables and how each will be measured
    “This is not in our area.” Outside the department’s scope or the supervisor’s field Re-anchor it in a departmental subject area, or accept a different supervisor

    Notice what is not on this list: originality in the grand sense. An undergraduate project does not have to be novel to the world. It has to be bounded, feasible and not already sitting in your department’s project archive.

    Fault 1: too broad — the fix is three specifics

    “Impact of social media on students” is not a topic; it is a subject area. It has no population you can sample, no location you can reach and no period.

    Add three things and it becomes researchable:

    • Who — “300-level Mass Communication students”
    • Where — a named faculty, institution or organisation
    • When — the academic session

    “Influence of social media use on the academic performance of 300-level Mass Communication students in [named institution], 2026/2027 session” is the same idea, and it is approvable. It also hands you your Chapter One scope section for free, as set out in the guide to writing Chapter One.

    Fault 2: not feasible — the access question decides everything

    This is the rejection that most often comes disguised as something else, and it is the one that would have hurt you most if it had been approved.

    Before you submit any topic, answer one question honestly: can you personally reach these respondents, this session, without a gatekeeper who may say no?

    Topics that fail this test look ambitious and are traps: bank staff across several branches, civil servants in a ministry, hospital patients, secondary school pupils in a state, respondents in another city. Each one needs written permission from an organisation that has no obligation to reply quickly.

    Topics that pass it are the ones you can actually finish: students in your own faculty, traders in a market you can visit, staff of a single organisation where you have a contact, or a documentary study using published records.

    Choosing an accessible population is not lowering your ambition. It is the difference between finishing and not.

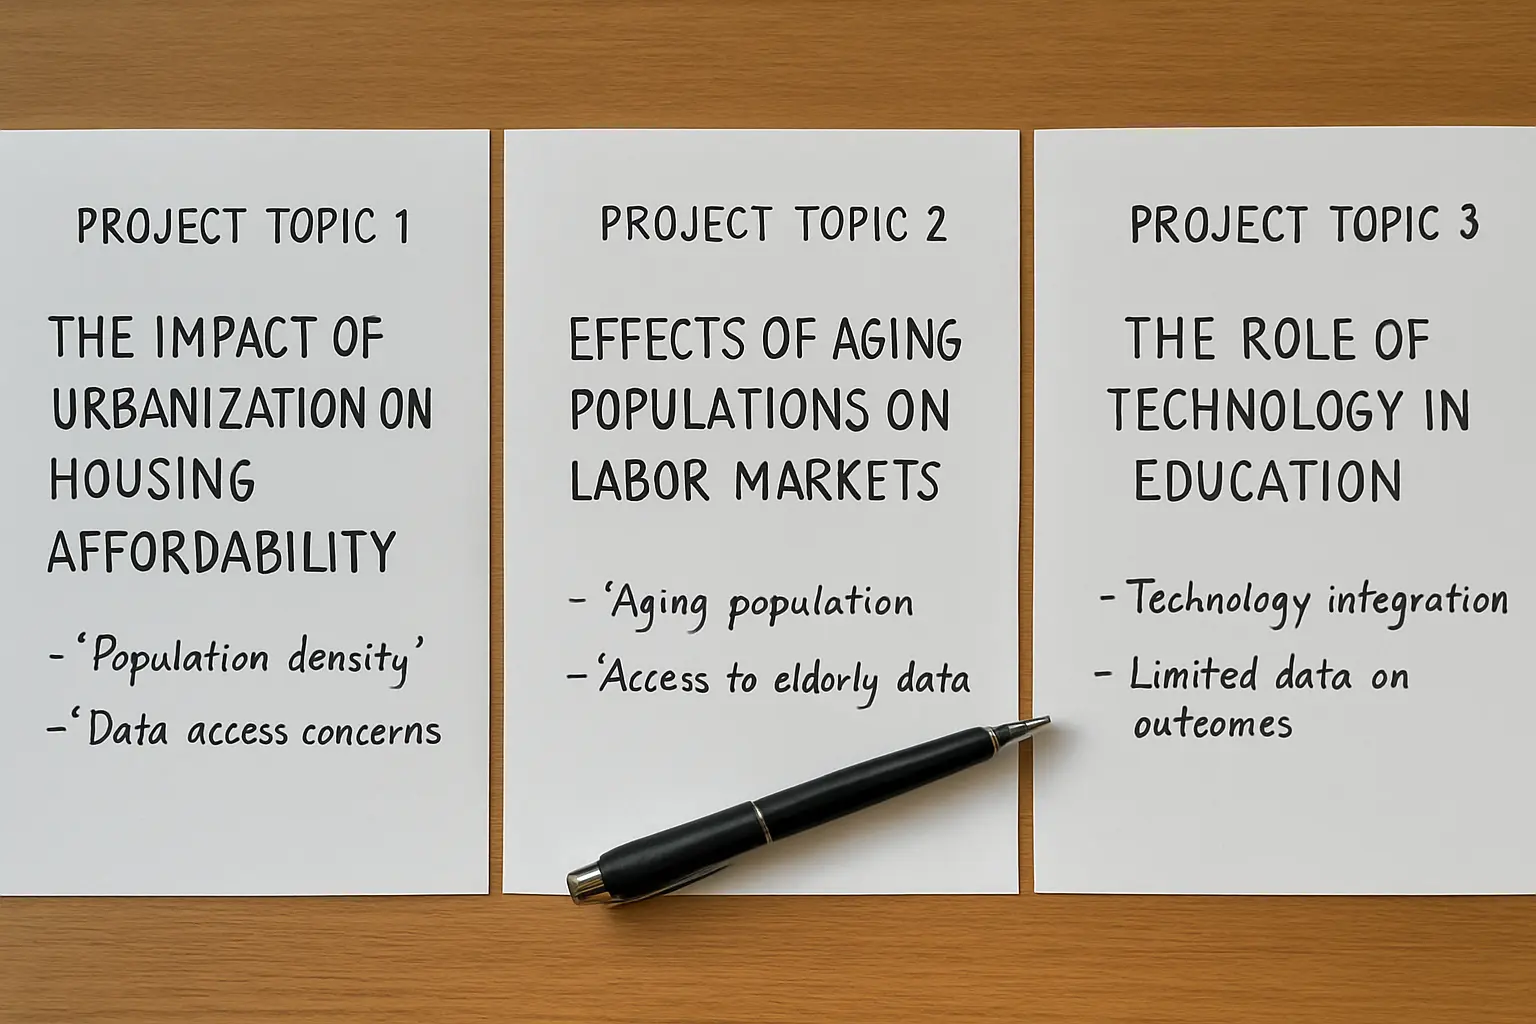
    Three candidate project topics written on separate sheets and annotated with notes on population and data access
    Never submit one topic. Submit three, each annotated with who the respondents are and how you will reach them.

    Fault 3: already done — change the substance, not the wording

    Departments keep project archives, and a supervisor who has read a hundred projects recognises one immediately.

    Rewording does not help and it is transparent. What works is changing one of three things:

    1. The population. The same question asked of a different group is a different study.
    2. A variable. Add a moderating or mediating factor the earlier project did not consider.
    3. The context or period. A study conducted before a major policy or technology change is genuinely a different setting.

    Before you resubmit, go to the department’s project archive and look. Ten minutes there prevents the third rejection, and it also gives you your first citations. If your topic is one where you want to know how much has actually been published, the counting method is in the article on whether your project topic has already been studied in Nigeria.

    Fault 4: unmeasurable variables

    “What are you measuring?” means your topic names concepts that cannot be turned into questionnaire items or observations.

    The test: for each variable in your title, can you say in one sentence how it will be measured? “Academic performance” measured as CGPA is fine. “Effectiveness” with no stated measure is not. “Awareness” measured as a score on a set of items is fine; “awareness” on its own is not.

    Write the measurement beside each variable before you submit. This is also the exact question a panel asks at the proposal seminar, which is covered in the guide to writing a research proposal for a Nigerian final year project.

    Fault 5: outside the department’s area

    Sometimes the topic is fine and simply belongs to another department. A supervisor who says “this is not our area” is telling you they cannot examine it, not that it is a bad idea.

    Two moves. Re-anchor the same interest inside your discipline — a technology question becomes a management question if the variables are adoption and productivity rather than architecture. Or ask the coordinator whether a supervisor in the relevant subject area is available. Neither takes long, and both are better than a fourth submission of the same thing.

    The one-page brief that gets approvals

    Stop submitting titles. Submit a page. Supervisors reject titles because a title gives them nothing to approve, and approving it blind is a risk they carry for a whole session.

    Bring three candidate topics, each on the same one-page format:

    1. Working title — with population, location and period in it.
    2. The problem, in two sentences. What is wrong, and for whom.
    3. Objectives — three or four, each starting with a verb.
    4. Population and access — who they are, roughly how many, and how you will reach them. Name the contact or the route.
    5. Variables and measurement — one line each.
    6. Method — design, instrument, and roughly how the data will be analysed.
    7. Three sources — real ones you have opened, showing the area is researched.

    Three of those pages is about twenty minutes of a supervisor’s time and it changes the conversation completely. Instead of “is this a good topic?” — a question they answer defensively — you are asking “which of these three should I do?”, which is a question they can answer in five minutes and which makes them a collaborator in the choice.

    It also means a rejection of one candidate does not cost you a week. You still have two live.

    A Nigerian student handing a single-page topic brief to a supervisor reading it in a university office
    A title asks your supervisor to take a risk. A one-page brief asks them to make a choice.

    Do not buy a topic to end this faster

    At exactly this point, a vendor selling ready-made project topics and materials starts to look like the sensible option. It is the most expensive shortcut available at this stage, and the reasons are set out in full in the article on what you are actually buying from project topics and materials sites.

    The short version, specific to the topic stage: a bought topic comes with a population you have not verified you can reach, variables you did not choose, and often a study your department has already seen. You will still fail faults 2 and 3 — just later, and after paying.

    What to do in the next 48 hours

    1. Read your rejection again and map it to a fault above. If the comment was too short to map, ask one specific question — “was it the scope or the access?” — rather than a general “why?”.
    2. Go to the department’s project archive and list what has been done in your area in the last three sessions.
    3. Write three one-page briefs, each with a population you can genuinely reach.
    4. Book the consultation and take all three.
    5. The moment one is approved, start Chapter One that day. Approval is not a milestone to celebrate for a week; it is the starting gun.

    That last point matters more than any of the others. The weeks lost to topic rejection come out of the analysis stage, not the writing stage, and the analysis stage is where projects actually run out of time.

    How Tesify shortens the part that comes next

    Once a topic is approved, the constraint changes from decision-making to volume: Chapter One’s sections, a literature review from sources you can actually cite, and a methodology that matches what you promised in the brief.

    Tesify takes your approved topic, your population and your sources, and builds the chapters in the structure your department expects — holding the section order, keeping every citation attached to a source you actually opened, and turning your notes into academic prose. The decisions stay with you, which is exactly why the work survives a defence.

    Three things it removes from the week after approval:

    • Structure. The chapter shape is there before you write a sentence, so you are filling a form rather than inventing one.
    • The reference trail. Citations stay attached to their sources instead of being reconstructed at 2 a.m. before submission.
    • Restarting. The blank page after each supervisor comment is where most of the lost time actually goes — the same loop described in the article on breaking the Chapter Two correction cycle.

    If you have not even reached the topic stage cleanly and are starting from nothing, the week-one system is in the guide to starting your final year project this week.

    Get the approval, then move the same day

    Tesify structures your project chapter by chapter around your own approved topic, your own respondents and your own sources, and keeps every citation attached to a source you actually opened. Over 9,000 students have used it to write more than 15,000 chapters, and 100 per cent of the work is still written by you. Current pricing, including what you can do before paying anything, is listed on the Tesify site.

    Start Chapter One in Tesify

    Frequently asked questions

    Why does my supervisor keep rejecting my project topic?

    Almost always for one of five structural reasons: it is too broad, the respondents are not reachable in one session, the study already exists in the department, the variables cannot be measured, or it falls outside the department’s area. Ask which one applies rather than resubmitting a reworded version of the same topic.

    How much does Tesify cost in naira?

    Payment methods and pricing change, so the reliable source is the Tesify site itself rather than a figure quoted in an article. What you can do before paying anything is listed there too. Nothing about the topic-approval process above requires you to pay for anything.

    Is using a tool like this considered cheating?

    That depends on your department’s policy, which you should confirm with your supervisor rather than assume. The distinction that matters is authorship: the topic, the population, the design and the interpretation are yours, and a tool that structures and drafts around your decisions is different from one that supplies a study. The full treatment is in the article on whether you can use AI to write your final year project.
    Will this raise my similarity score?

    Text you write about your own respondents and your own data has nothing to match against and behaves like any other original writing. What raises a score is uncited paraphrase of other people’s work, and what your department’s threshold actually is differs by institution — set out in the article on acceptable plagiarism percentages in Nigerian universities.

    How many topics should I submit at once?

    Three, each on a one-page brief. One topic asks your supervisor to take a risk; three ask them to make a choice, which is a much easier thing to do quickly. It also means one rejection does not cost you another week.

    Can I use a topic from a project topics website?

    You can look at one for ideas, but do not submit it as yours. It will usually fail on access or on already having been done in your department, and you will discover that after paying. The risks are covered in the article on project topics and materials in Nigeria.

    What if my supervisor gives no reason at all?

    Ask one closed question rather than an open one. “Was the problem the scope or the access to respondents?” gets an answer in a corridor; “why was it rejected?” often does not get answered at all.

    Should the topic be quantitative or qualitative?

    Whichever answers your question, but be aware that the sample-size justification differs sharply and that many Nigerian departments expect a formula. If you are considering a qualitative design, read how to defend the sample first, in the article on how many respondents a qualitative project needs.

    How specific should the title be?

    Specific enough that a reader knows the variables, the population, the location and the period without asking. If any of those four is missing, expect “narrow it down”.

    Does the topic have to be original?

    Not original to the world. It has to be bounded, feasible and not a repeat of an existing project in your own department. Changing the population, adding a variable or shifting the context is enough to make an existing question a new study.

    What if I lose weeks to this and fall behind?

    Compress the stage after approval rather than the analysis stage. Draft Chapter One and the proposal immediately, since both come straight out of the brief you already wrote, and protect the weeks you will need for data collection and analysis. Losing time at the front is recoverable; losing it at the back is not.

  • What Statistical Test Should You Use for Your Final Year Project? (2026)

    What Statistical Test Should You Use for Your Final Year Project? (2026)

    Match the test to the shape of your research question, not to what your friend used. “What is the level of X” needs only means and percentages. “Is there a significant relationship” needs Pearson’s r, Spearman’s rho or chi-square depending on your data type. “Is there a significant difference” needs a t-test or ANOVA. “Does X affect Y” needs regression.

    How do you actually choose?

    One question decides almost everything: what shape is my research question, and what kind of data did my instrument produce?

    Nigerian undergraduate research questions come in five shapes, and each shape has a standard answer. Find yours in the left column.

    Your research question asks… Data type Test
    What is the level / extent of X? Likert items Mean and SD against the criterion mean — no inferential test
    What are the characteristics of respondents? Categories Frequency and percentage
    Is there a significant relationship between X and Y? Both scale / continuous Pearson’s r
    Is there a significant relationship between X and Y? Both categorical Chi-square test of independence
    Is there a significant relationship between X and Y? Ordinal, or not normally distributed Spearman’s rho
    Is there a significant difference between two groups? Scale outcome Independent-samples t-test
    Is there a difference before and after? Same respondents twice Paired-samples t-test
    Is there a significant difference among three or more groups? Scale outcome One-way ANOVA
    Does X affect / predict Y? Scale outcome Simple or multiple linear regression

    Two things to notice. Most Nigerian undergraduate projects need only two or three of these, not all of them. And the first two rows are not tests at all — a great many research questions are answered completely by a mean table, which is why running a chi-square on them adds nothing.

    Does every research question need a statistical test?

    No, and this is the most useful thing on this page.

    A research question of the form “What is the level of awareness of X among Y?” is descriptive. It is answered by a mean and a standard deviation for each item, compared against your criterion mean, with a decision column. There is no null hypothesis, nothing to reject, and no test statistic. Adding one does not make the project more rigorous; it makes it harder to defend, because you will be asked what the test was for.

    Inferential tests belong to your hypotheses, not to your research questions. If your project has four research questions and two hypotheses, you likely need two inferential tests and four descriptive tables. Where each of those lands in the chapter is set out in the guide to writing Chapter Four.

    Which test for a relationship?

    All three of the common options answer “is there a relationship”, but they need different data.

    • Pearson’s r when both variables are continuous or are scale scores built by averaging several Likert items. It gives a coefficient between −1 and +1, so it tells you direction and strength as well as significance.
    • Spearman’s rho when your variables are ordinal, or when Pearson’s normality assumption fails. It is a tick-box in the same dialog as Pearson, so switching costs nothing.
    • Chi-square test of independence when both variables are categories — sex against departmental choice, level against whether a respondent owns a laptop. Chi-square tells you whether an association exists, but not its direction or strength.

    The most common error here is running chi-square on a mean. Chi-square works on counts in a contingency table. If your variable is a score, it is the wrong tool, and it is a question a panel asks precisely because it is easy to check.

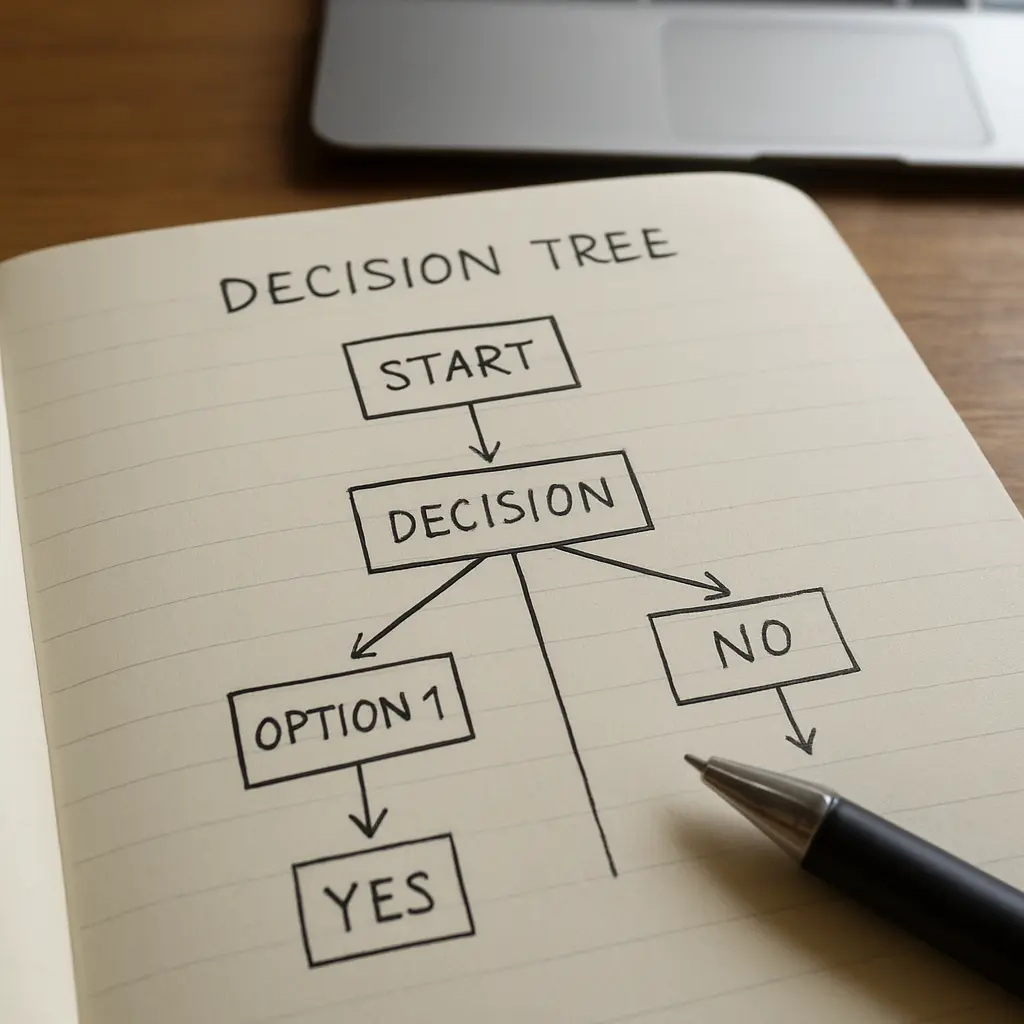
    A two-column handwritten sheet pairing each research question with the test chosen for it
    Write the pairing down before you touch software. One research question, one method, and nothing left over.

    Which test for a difference between groups?

    Count the groups.

    Two groups — male against female, urban against rural — is an independent-samples t-test. In SPSS the path is Analyze, then Compare Means and Proportions, then Independent-Samples T Test, and the dialog will not run until you click Define Groups and tell it which two codes are being compared.

    Three or more groups — 300, 400 and 500 level; four departments — is a one-way ANOVA, under Analyze, then Compare Means, then One-Way ANOVA. Running three separate t-tests instead of one ANOVA is a real error rather than a stylistic one, because each additional comparison inflates the chance of a false positive.

    The same respondents measured twice — before and after an intervention — is a paired-samples t-test, not an independent-samples one. Using the independent version on paired data throws away the pairing that makes the design worth running.

    Why does everyone in my department use chi-square?

    Because it is taught first, it is computable by hand, and it works on the categorical data that questionnaires produce most easily. For a genuinely categorical hypothesis it is the correct test.

    It becomes a problem when it is applied by default. If your hypothesis concerns whether two scores are related, chi-square is not the tool, and forcing it means binning your scores into categories and discarding information you collected. If your department requires chi-square and your data is continuous, raise it with your supervisor early rather than at the defence, and be ready to say why the alternative fits better.

    What assumptions do you have to check first?

    Two, for most undergraduate designs, and both take one dialog box each.

    Normality. In SPSS, Analyze, then Descriptive Statistics, then Explore; put your variable in the Dependent List, open Plots, and tick Normality plots with tests. That single checkbox produces a Kolmogorov-Smirnov test, a Shapiro-Wilk test, a normal Q-Q plot and a detrended Q-Q plot together.

    Read the result carefully, because the logic runs backwards from what you are used to. The null hypothesis of a normality test is that the data came from a normal distribution, so p ≤ .05 means you reject normality. A significant result here is the inconvenient one. The two tests also carry separate p-values and can disagree, so say which one you used rather than reporting whichever was friendlier.

    Homogeneity of variance. Levene’s test asks whether your groups have the same spread. One current detail matters: prior to SPSS Statistics version 31, Levene’s Test appeared automatically in the Independent-Samples T Test output; as of version 31 it is optional output that must be requested. If you were expecting a Levene’s row and cannot find one, that is why.

    What if an assumption fails?

    You substitute the test. You do not delete data and you do not proceed as though nothing happened.

    Planned test Substitute when the assumption fails
    Independent-samples t-test Mann-Whitney U test
    Paired-samples t-test Wilcoxon signed-rank test
    One-way ANOVA Kruskal-Wallis test
    Pearson’s r Spearman’s rho

    If it is specifically the equal-variances assumption that failed on a t-test, you do not need to leave the parametric family at all: SPSS reports a Welch t-test — the unequal-variance version — on the second line of the same output block. Read that line and say that you did. For a one-way ANOVA with unequal variances, use a post hoc test that does not assume equal variances, such as Dunnett’s C.

    None of these substitutions weakens your project. When assumptions hold, the parametric test is more powerful; when they do not, it is simply wrong, and the correct comparison is against a valid alternative rather than an invalid one.

    Statistical output tables on a laptop screen beside a printed questionnaire
    Decide the test before you open the software. A tool chosen after seeing the output is a tool you cannot justify.

    What do you write in Chapter Three?

    Name each tool and tie it to the specific question or hypothesis it answers. One sentence per tool is enough:

    “Research questions one to three were answered using mean and standard deviation, with a criterion mean of 2.50. Hypothesis one was tested using the chi-square test of independence at the 0.05 level of significance, and hypothesis two using Pearson’s product-moment correlation coefficient. All analyses were carried out using IBM SPSS Statistics.”

    Whatever appears there must be exactly what appears in Chapter Four — no extra tools, none quietly swapped. If a substitution happened because an assumption failed, amend Chapter Three to say so and why. “Why did you use this test?” is a standard question, and it is on the list in the guide to what is asked during a project defence. Where the tools sit in the overall structure is covered in how many chapters a final year project has, and the research questions they answer are framed back in Chapter One.

    Keep the method and the results saying the same thing

    Tesify holds your chapters in the structure your department expects, so the tool you name in Chapter Three and the table you build in Chapter Four cannot drift apart while you work. Over 9,000 students have used it to write more than 15,000 chapters, and every word is still written by you.

    Set up your project in Tesify

    Frequently asked questions

    What statistical test should I use for my project?

    Match it to your research question. Level or extent questions need mean and standard deviation only. Relationship questions need Pearson’s r, Spearman’s rho or chi-square depending on data type. Difference questions need a t-test for two groups or ANOVA for three or more. Prediction questions need regression.

    Do I need a statistical test for every research question?

    No. Descriptive research questions are fully answered by means, standard deviations and percentages. Inferential tests belong to your hypotheses, and adding one where no hypothesis exists invites a question you cannot answer.

    When do I use chi-square?

    When both variables are categories and you are testing whether they are associated. It works on counts in a contingency table, so it is the wrong tool for a mean or a scale score.

    What is the difference between Pearson and Spearman?

    Pearson’s r is for continuous variables that meet the normality assumption; Spearman’s rho is the rank-based version for ordinal data or when normality fails. In SPSS both are tick-boxes in the same Bivariate dialog.

    Can I use a t-test for three groups?

    No. Use a one-way ANOVA. Running several t-tests across three groups inflates the chance of finding a difference that is not there, and a panel that spots it will ask about it.

    How do I know if my data is normally distributed?

    Run Analyze, Descriptive Statistics, Explore, then Plots, and tick “Normality plots with tests”. Read the Shapiro-Wilk and Kolmogorov-Smirnov p-values, remembering that a p-value at or below .05 means the data is not normal.

    What do I do if my data is not normally distributed?

    Substitute the test: Mann-Whitney U for an independent-samples t-test, Wilcoxon signed-rank for a paired t-test, Kruskal-Wallis for a one-way ANOVA, Spearman’s rho for Pearson’s r. Then record the substitution and its reason in Chapter Three.

    Can I analyse a four-point Likert scale with a mean?

    A single Likert item is strictly ordinal, and its proper measures are the median and mode. Most Nigerian departments nonetheless require a weighted mean per item against a criterion mean, and where your department requires it, you follow your department. Scale scores averaged across several items are more defensible as continuous.

    What significance level should I use?

    0.05 unless your department specifies otherwise, and state it explicitly in Chapter Three. Do not change it after seeing your results.

    Do I need SPSS, or can I use Excel?

    Excel handles means, standard deviations, percentages and simple correlation. Dedicated statistical software is more comfortable for ANOVA, non-parametric tests and normality checks. Name whichever you actually used in Chapter Three.

    My supervisor says to use a test I do not understand. What do I do?

    Ask which research question or hypothesis it answers, and write the answer down. If you cannot say what a test is for, you cannot defend it, and the question will come at the worst possible moment.

    Can I change my test after seeing the results?

    Only for a stated methodological reason such as a failed assumption, and you must record the change and its reason in Chapter Three. Changing tests until one returns significance is a different thing entirely, and it is visible to anyone who reads the chapter carefully.

  • How to Analyse Your Project Data in SPSS, Step by Step (2026)

    How to Analyse Your Project Data in SPSS, Step by Step (2026)

    The questionnaires are back. There are two hundred and thirty of them in a nylon bag, SPSS is open on a borrowed laptop, and the cursor is blinking in an empty grid. This is where most Nigerian project groups lose a week — not to the statistics, which are usually simple, but to not knowing the order of operations.

    What follows is that order, in nine steps, with the exact menu path for every procedure an undergraduate project needs. Paths are quoted as documented in Kent State University Libraries’ freely available SPSS tutorials; recent versions keep them stable, but if a menu on your machine reads slightly differently, trust your machine.

    Two things belong upstream of this guide. You should already know which tool answers which research question — that decision is made in choosing the statistical test for your project, not in the software. And what you do with the output afterwards is a separate skill, set out in writing Chapter Four.

    Step 1: Number the questionnaires before you touch a computer

    Output: a physical stack in which every usable copy carries a unique case number.

    1. Separate the incomplete copies into their own pile. Count both piles and write both counts down; your return rate needs them.
    2. Write 1, 2, 3 in the top corner of each usable questionnaire.
    3. Keep the stack in that order for the whole encoding session.

    This takes fifteen minutes and it is the only thing that makes an encoding error recoverable. When SPSS later shows a respondent aged 220, the case number tells you which sheet of paper to check. Without it you are re-reading 231 questionnaires to find one typo.

    A stack of questionnaires with case numbers handwritten in the top corner of each
    Fifteen minutes with a pen. This is what turns “there is an error somewhere” into “the error is on copy 147”.

    Step 2: Build the variable list before entering a single response

    Output: a complete Variable View, filled in before any data exists.

    Click the Variable View tab at the bottom of the data editor. Every questionnaire item becomes one row, and four columns matter.

    • Name — short, no spaces, systematic. Use sex, level, dept, then B1 to B10 and C1 to C10 so the names mirror the sections of your instrument.
    • Label — the full item text. This is what prints on your output tables, so a good label here saves retyping every row of Chapter Four by hand.
    • Values — the numeric code for each option: 1 = Strongly Disagree through 4 = Strongly Agree, or 1 = Male, 2 = Female.
    • Measure — Nominal for categories such as sex or department, Ordinal for Likert items, Scale for genuinely continuous variables such as age or a computed total.

    Getting Measure right early prevents a whole class of later confusion, because SPSS uses it to decide which procedures it offers you for a variable.

    A handwritten codebook page mapping questionnaire answer options to numeric codes
    Agree the codebook on paper first. If three of you are encoding on three laptops, this page is the only thing that makes the files mergeable.

    Step 3: Encode the responses, one row per respondent

    Output: a Data View grid with as many rows as you have usable questionnaires.

    Switch to Data View and work down the numbered stack. One respondent is one row; one item is one column. Never put two respondents on one row and never spread one respondent across two.

    Three rules prevent the expensive mistakes. Leave a genuinely unanswered item blank rather than typing 0 — zero is a real value and it will drag your mean down. Decide as a group how to treat an item where a respondent ticked two boxes, then apply that decision to every case rather than case by case. And if you split encoding across several laptops, agree the codebook in writing first, because merging three files that coded sex differently costs more than the encoding did.

    Save as a .sav file after every fifty cases, with the date in the filename.

    Step 4: Reverse-score the negatively worded items

    Output: new variables in which every item points the same direction.

    If your instrument contains an item like “Power supply has no effect on how long I study”, a high score there means the opposite of a high score on the rest of the scale. Averaging it in unreversed will depress your grand mean and wreck your reliability coefficient.

    1. Go to Transform > Recode into Different Variables.
    2. Move the negatively worded item across and give the output variable a new name, such as B7r.
    3. Click Old and New Values and enter the reversal for a four-point scale: 1→4, 2→3, 3→2, 4→1.
    4. Click Add for each pair, then Continue and OK.

    Always recode into a different variable, never over the original. Keeping the raw column means a mistake here is one recode away from being fixed rather than a re-encoding away.

    Step 5: Screen the data before you analyse it

    Output: a frequency table for every variable, checked against the range each is allowed to take.

    Run Analyze > Descriptive Statistics > Frequencies, move all your variables across, and read the output for three things.

    • Impossible values. A four-point item with a maximum of 5 is a typo. Find the case number and check the paper.
    • Missing counts. Every variable’s Valid N should equal your analysed N unless you know why it does not.
    • Category totals. The frequencies for sex should sum to your N. If they do not, a case is miscoded.

    Fix everything you find here before running anything else. An error corrected now costs a minute; the same error found after three tables are written costs the afternoon.

    Step 6: Run the reliability analysis

    Output: a Cronbach’s alpha for each section of your instrument.

    1. Go to Analyze > Scale > Reliability Analysis.
    2. Move in the items of one section only — Section B on its own, then Section C on its own. A scale measuring two different constructs is not one scale.
    3. Leave the Model on Alpha.
    4. Click Statistics and tick Item, Scale, and Scale if item deleted.
    5. Read the alpha, then read the “Cronbach’s Alpha if Item Deleted” column to see whether one bad item is dragging the section down.

    Report the coefficient with the number of items and the pilot sample it came from, in Chapter Three. You will be asked at the defence which software produced it, so do not report a figure you did not compute.

    Step 7: Produce the descriptive tables Chapter Four needs

    Output: the bio-data table and the per-item mean tables, in that order.

    For the respondent profile — sex, level, department — use Analyze > Descriptive Statistics > Frequencies and take the frequency and percentage columns straight into your table.

    For the “level of” or “extent of” research questions, use Analyze > Descriptive Statistics > Descriptives with the Likert items of that section selected; the Mean and Std. Deviation columns are exactly what your table needs. For the grand mean, build a computed variable first with Transform > Compute Variable using the MEAN function across the items of that section.

    Compare each mean against your criterion mean — 2.50 on a four-point scale — and fill the Decision column accordingly.

    Step 8: Run the inferential test each hypothesis needs

    Output: one output block per hypothesis, and no blocks you cannot attach to a hypothesis.

    What your hypothesis asks Procedure Menu path
    Are two categorical variables associated? Chi-square test of independence Analyze > Descriptive Statistics > Crosstabs, then Statistics > Chi-square
    Are two scale variables related? Pearson correlation Analyze > Correlate > Bivariate
    Are two ordinal or non-normal variables related? Spearman’s rho Analyze > Correlate > Bivariate, tick Spearman
    Do two groups differ? Independent-samples t test Analyze > Compare Means and Proportions > Independent-Samples T Test
    Do three or more groups differ? One-way ANOVA Analyze > Compare Means > One-Way ANOVA
    Is the distribution normal? Shapiro-Wilk and Kolmogorov-Smirnov Analyze > Descriptive Statistics > Explore, then Plots > Normality plots with tests

    Three details the dialogs will force on you. In Crosstabs the chi-square statistic is not produced unless you tick it under Statistics — the crosstab alone is only a contingency table, and this is the single most common reason a Nigerian student cannot find their chi-square value. In Bivariate, Pearson is selected by default and the test is two-tailed by default, with significance flagged at the .05 and .01 levels. And the Independent-Samples T Test will not run until you click Define Groups and specify the two codes being compared.

    Step 9: Save the output and reconcile it before writing

    1. Save the data as .sav and the output as .spv, both dated, and copy both to a second device or a cloud folder.
    2. Check that the Valid N on your output matches the analysed N you stated in Chapter Three.
    3. Check that every research question and hypothesis has exactly one output block, and delete the exploratory runs you did along the way.
    4. Check that the tools that produced your output are the ones you named in Chapter Three. If you changed one, change the chapter too.

    Only then start writing. A Chapter Four built from unreconciled output will contradict Chapter Three somewhere, and that contradiction is the first thing a panel finds — as the standard question list in what is asked during a project defence makes clear. How the analysis chapter sits within the whole document is summarised in how many chapters a final year project has.

    You have the output. Now write the chapter.

    Tesify holds your chapters in the structure your department expects and keeps every citation attached to a source you actually opened, so the week after analysis goes into interpretation rather than formatting. Over 9,000 students have used it to write more than 15,000 chapters, and every word is still written by you.

    Write up your results in Tesify

    Frequently asked questions

    How do I analyse my project data using SPSS?

    Number the questionnaires, build the full Variable View before entering data, encode one row per respondent, reverse-score the negative items, then screen with Frequencies. Only after screening do you run reliability, descriptives and your inferential tests.

    What is the menu path for Cronbach’s alpha?

    Analyze > Scale > Reliability Analysis, with the Model left on Alpha. Enter one section at a time and tick “Scale if item deleted” under Statistics to see which item is weakening it.

    Why is my chi-square value not showing?

    Because it is not produced by default. Open the Statistics button inside the Crosstabs dialog, tick Chi-square, then run it again.

    How do I encode a four-point Likert scale?

    Set the item’s Measure to Ordinal and define its Values as 1 to 4 with the verbal label attached to each number. Then type only the numbers into Data View.

    Should I enter 0 for an unanswered item?

    No. Leave it blank. Zero is a real value on a numeric variable and it will pull the mean down and misstate the count of valid responses.

    Do I have to reverse-score negative items?

    Yes, if you are averaging items into a section score or computing a reliability coefficient. Skipping it is the commonest cause of an unexpectedly low Cronbach’s alpha in an otherwise sound instrument.

    How do I get the grand mean in SPSS?

    Build the section score first with Transform > Compute Variable using the MEAN function across that section’s items, then run Descriptives on the new variable.

    Which SPSS version do I need?

    Any recent version handles everything an undergraduate project needs. Menu wording shifts slightly between releases, so state in Chapter Three the version you actually used rather than copying a number from another project.

    My groupmates encoded on separate laptops and the files will not merge. What now?

    Compare the Variable View of each file side by side before merging. Mismatched variable names, different codes for the same answer and different Measure settings are the usual culprits, and all three are fixable in the file that deviates rather than by re-encoding.

    Do I keep the output file after the defence?

    Keep it until your project is finally approved and bound. Panels ask to see output, corrections can require reruns, and rebuilding a lost analysis from paper questionnaires under deadline is a miserable weekend.

    Can I do all of this without SPSS?

    Yes. Free packages cover the same undergraduate procedures, and spreadsheets handle means and percentages. Whichever you use, name that one in Chapter Three rather than naming SPSS by habit.

  • How to Write Chapter Five of a Final Year Project in Nigeria: Summary, Conclusion, Recommendations and Contribution to Knowledge (2026)

    How to Write Chapter Five of a Final Year Project in Nigeria: Summary, Conclusion, Recommendations and Contribution to Knowledge (2026)

    Chapter Five carries four things and they are not the same thing. The summary restates your Chapter Four findings with no new interpretation. The conclusion answers each research question directly. The recommendations say what a named body should do. The contribution to knowledge states what is now known that was not known before — and in Nigeria that is a required element, not an optional flourish.

    It is the shortest chapter and the one most students write in one night, which is why it is also the one that most often contradicts the rest of the project. A panel reading four research questions in Chapter One, three tables in Chapter Four and five conclusions in Chapter Five does not need to check your statistics to know something is wrong.

    This guide assumes Chapter Four is finished, because Chapter Five is assembled almost entirely from material it already contains — see how to write Chapter Four if it is not.

    Step 1: Take the section headings from your department, not from a downloaded project

    Expected output: the exact headings your department requires, written down before you draft.

    The usual Nigerian title is “Summary, Conclusion and Recommendations”, sometimes with “Summary of Findings” as a separate first section. Obafemi Awolowo University’s guidelines are the useful reference point here because they specify the main body by required elements rather than by chapter count, and one of those elements is the contribution to knowledge — a distinction set out in the guide to how many chapters a final year project has. Most departments fold that element into the final chapter.

    Some departments also expect a short restatement of the study — problem, objectives and method in two or three sentences — at the top of the chapter, for a reader who opens at the end. Check yours; do not reproduce your whole Chapter Three.

    Step 2: Build the summary of findings from your tables, in order

    Expected output: one short numbered paragraph per research question, containing the figures and nothing else.

    Open Chapter Four, take each table in the order it appears, and write one sentence stating what it showed. Then stop. No causes, no comparison with other studies, no new tables.

    Where your instrument used a four-point scale, the summary reports the mean against the criterion your Chapter Four used. Most Nigerian departments use 2.50 on a four-point scale, so a mean at or above it is reported as agreement and one below it as disagreement. Say which criterion you used; do not assume the reader knows.

    Write the findings in the past tense, and make every figure identical to the table it came from, to the same number of decimal places. A mean that reads 3.14 in Chapter Four and 3.1 in Chapter Five is exactly the inconsistency a panellist notices while turning pages.

    Step 3: Write one conclusion for each research question

    Expected output: the same number of conclusions as research questions, in the same order.

    A conclusion is the answer to a question you asked in Chapter One. Copy your research questions out of Chapter One, paste them onto a blank page, and write one conclusion under each. That is the structure, and it is the first thing a panel checks.

    The difference between a finding and a conclusion is the level of generality. The finding is about your respondents and carries the number; the conclusion is about the variable and carries none.

    • Finding: “Respondents rated access to credit at a mean of 2.14, below the 2.50 criterion.”
    • Conclusion: “Small business owners in the study area do not consider formal credit accessible.”

    Two cautions. Do not generalise past the population your Chapter Three defined — a conclusion about “Nigerian SMEs” drawn from 300 respondents in one local government area is the easiest question a panel will ask all day. And where you tested a hypothesis, the conclusion must carry the decision explicitly: “The null hypothesis is rejected; there is a significant relationship between access to credit and business growth.” Whether that decision came from a p-value or from comparing a calculated value against a critical table value, state which convention you used, as your Chapter Three promised.

    An examiner holding the final chapter of a project open while questioning a student at a defence
    Panels test Chapter Five backwards: they take a recommendation and ask which finding produced it.

    Step 4: Address every recommendation to a named body

    Expected output: a numbered list in which each entry names who should act and the finding that justifies it.

    The most common single fault in a Nigerian Chapter Five is a recommendation nobody could act on: “government should do more to support SMEs”. It names no actor, no action and no finding. Replace it with a fixed sentence shape:

    “Since the study found that [finding], it is recommended that [named body] [specific action].”

    Worked example:

    “Since respondents rated access to formal credit below the criterion mean (2.14) while rating awareness of loan schemes above it (3.02), it is recommended that the Bank of Industry desk officer in the local government area shorten the documentation requirement rather than expand publicity, because awareness is not the constraint.”

    The named bodies in a Nigerian project are usually concrete: the department, the faculty board, the local government, a named agency, the management of the firm you studied, or your professional association. Name whichever your data actually reaches. If you recommend something to a body you did not study, a panellist will ask how your data supports it.

    Close with recommendations for further study, drawn from your own scope and delimitation rather than from the standard three. “A larger sample, a longer period, and other variables” is the answer every panel has read a hundred times. “This study surveyed only registered traders; unregistered traders were excluded by the sampling frame and are the obvious next population” is a real recommendation.

    Step 5: Write a contribution to knowledge an undergraduate can defend

    Expected output: two to four short statements of what is now known that was not known before.

    This section frightens students because “contribution to knowledge” sounds doctoral. It is not, at this level. A doctoral thesis has to contribute something previously unknown to the field; a final year project is examined on whether you can carry out and report research competently, and the contribution expected is proportionate.

    What counts:

    • New evidence in a setting nobody had measured. “This study provides the first survey evidence on X among Y in Z local government area.”
    • A relationship tested where it had only been asserted. “It establishes empirically a relationship that earlier Nigerian studies had assumed.”
    • An instrument adapted and validated for a Nigerian population. If you reworded a foreign instrument and reported its reliability, say so.
    • A usable output. A framework, a checklist, a model or a piece of software that did not exist before.

    What does not count: repeating your findings in different words, or claiming to have “filled a gap in the literature” without naming the gap that Chapter Two identified. Panels ask “what is new here?” and “what should someone do with this finding?” — the pattern set out in what panels ask at a project defence. Two defensible sentences beat five inflated ones.

    A printed page headed Contribution to Knowledge with three short numbered statements
    Two or three specific statements, each tied to something in your own data. Scale is not what is being examined.

    Step 6: Keep new material out

    Expected output: a chapter with no new table, no new citation and no new variable.

    Every number in Chapter Five already appeared in Chapter Four. Every comparison with other studies already happened in the Chapter Four discussion. A variable appearing for the first time in the final chapter was never measured, and a citation appearing for the first time here suggests the literature was read after the conclusions were written.

    Also keep your reference list clean as you finish — a chapter written last is where stray in-text citations with no matching entry appear, and the style your department requires is a fact you can confirm from the handbook, as set out in how to reference the way your university requires.

    Step 7: Run the four-list alignment check

    Expected output: four lists of equal length in the same order.

    On one page, write out:

    1. your research questions from Chapter One, numbered;
    2. your objectives, numbered;
    3. the tables in Chapter Four, in order;
    4. your conclusions in Chapter Five, numbered.

    If your project tested hypotheses, add a fifth column for each decision. All of these should match in number, in order and in subject. Where they do not, either you answered something you never asked or you asked something you never answered, and both are cheap to fix now and expensive to fix at a defence. This check takes about fifteen minutes and is the highest-value quarter hour in the whole project.

    A filled-in template you can adapt

    For a descriptive study with three research questions, using the headings most Nigerian departments expect:

    5.1 Summary of Findings
    1. Most respondents were male (58.3%) and had operated their business for one to five years (61.7%).
    2. Access to formal credit was rated below the criterion mean (x̄ = 2.14), while awareness of available schemes was rated above it (x̄ = 3.02).
    3. A significant positive relationship was found between access to credit and reported business growth (r = 0.62, p < 0.05).

    5.2 Conclusion
    1. The respondent group is predominantly male and early stage.
    2. Small business owners in the study area are aware of formal credit schemes but do not find them accessible; awareness is therefore not the binding constraint.
    3. Access to credit and business growth are significantly related; the null hypothesis of no relationship is rejected.

    5.3 Recommendations
    1. Since awareness was rated above the criterion while access was rated below it, it is recommended that the scheme’s local desk officer reduce documentation requirements rather than expand publicity.
    2. Since credit access is significantly related to growth, it is recommended that the local traders’ association negotiate a group guarantee arrangement on behalf of members.
    3. It is recommended that future researchers extend the study to unregistered traders, who were excluded by this study’s sampling frame.

    5.4 Contribution to Knowledge
    1. The study provides survey evidence on credit access among registered small traders in the study area, where no prior measurement existed.
    2. It separates awareness from access empirically, showing that the two move independently in this population.
    3. It adapts and reports the reliability of a credit-access scale for a Nigerian small-trader population.

    Write the last chapter without breaking the first four

    Tesify keeps your research questions, tables and conclusions in one connected document, so the alignment check is something you can see rather than something you rebuild by hand at midnight. Start on the free plan, alongside 9,000+ students and 15,000+ chapters — every word still written by you.

    Write your Chapter Five in Tesify

    Frequently asked questions

    How do you write Chapter Five of a final year project?

    Summarise your Chapter Four tables in order, write one conclusion per research question, write recommendations that each name a body and a parent finding, then state your contribution to knowledge in two to four specific statements. Add no new tables, citations or variables.

    What is the difference between summary, conclusion and recommendation?

    The summary reports what your data showed, with figures. The conclusion answers your research question, without figures. The recommendation says what a named body should now do about it.

    What is contribution to knowledge in a final year project?

    A short statement of what is now known that was not known before — new evidence in an unmeasured setting, a relationship tested rather than assumed, an instrument adapted for a Nigerian population, or a usable output. It is a required element in guidelines such as OAU’s, and it is examined.

    How many conclusions should Chapter Five have?

    The same number as your research questions, in the same order. That one-to-one mapping is what a panel checks first.

    How long should Chapter Five be?

    There is no national page count and any figure you find online is somebody’s departmental rule presented as universal. It is normally the shortest chapter because it contains no tables and no citations. Check your own department’s guideline.

    Can I put a new table in Chapter Five?

    No. Every figure must already appear in Chapter Four. A table appearing for the first time in the final chapter raises the question of where the data came from.

    What tense should Chapter Five use?

    Findings in the past tense, because data collection is finished. Conclusions in the present tense, because you are stating what is now known. Be consistent within the chapter and follow your department where it specifies.

    My hypothesis was not supported. What do I write?

    State the decision plainly — “the null hypothesis is not rejected” — and conclude accordingly. A result that goes the other way is a finding, not a failure, and hiding it is far more damaging than reporting it.

    Does a qualitative project use the same structure?

    Yes, with themes in place of means. The summary reports the themes, the conclusions answer the research questions, and the recommendations follow from the themes. If you are still fixing your sample, see how many respondents a qualitative project needs.

    Where does Chapter Five sit in the proposal?

    It does not. A proposal is Chapters One to Three written in the future tense and defended before data collection — see how to write a research proposal. Chapter Five can only be written after Chapter Four exists.

    Do recommendations need to be numbered?

    Number them if your department allows it. Numbering makes the mapping from finding to recommendation visible at a glance, which is exactly the property being examined.

  • Best Citation Generator for APA Style: What Nigerian Students Should Actually Use (2026)

    Best Citation Generator for APA Style: What Nigerian Students Should Actually Use (2026)

    Rank Tool category Uses the open CSL style engine? Can install a department house style? Lives inside your document? Free entry point
    1 Zotero (desktop reference manager) Yes Yes — install a local CSL file Yes, Word and LibreOffice plugins Yes, free and open source
    2 Mendeley (reference manager) Yes Limited Yes, word processor plugin Yes, free tier
    3 ZoteroBib (no-install web tool) Yes No No Yes
    4 Web generators — Cite This For Me, EasyBib, Scribbr, MyBib, BibGuru, Citationsy Yes No No Varies; most have a free tier
    5 General chatbots No No No Yes

    The CSL column is taken from the Citation Style Language project’s own published list of software products that use CSL, read on 18 August 2026. Where this article quotes no price, none could be verified at source.

    The fact that reframes the whole question

    Most of the tools students compare are front ends over the same style engine.

    The Citation Style Language project states on its own site that it maintains “a crowdsourced repository with over 10,000 free CSL citation styles“, and it publishes a list of the software that uses them. That list names, among many others: Cite This For Me, EasyBib, Scribbr Citation Generator, MyBib, BibGuru, Citationsy, Bibcitation, CloudCite, RefWorks, Paperpile, Mendeley, ZoteroBib and Zotero.

    So when you compare “which generator formats APA 7th best”, you are frequently comparing two interfaces to the same underlying APA style definition. That explains something students find puzzling — why several different free tools produce byte-identical references.

    The practical consequence: the quality of your reference does not mostly come from which tool you picked. It comes from the metadata you fed it. A record missing an issue number produces a defective reference in every one of them, and no tool can invent the number.

    What genuinely differs between these tools is three things: whether you can install a custom style, whether the tool lives inside your document, and whether it keeps your library between sessions.

    The four criteria this ranking uses

    These are chosen for a Nigerian final year project specifically, not for a researcher publishing in a journal.

    1. Can it produce the style your department actually requires? Nigerian universities do not agree on one referencing style, and some departments mandate a house style that is not any published standard. This is the criterion that eliminates most web generators.
    2. Does it stay with you across a whole project? A project runs months. A tool that forgets your sources when you close the tab makes you re-enter them.
    3. Does it insert citations into your document? Copy-pasting each reference by hand is where numbering and ordering errors enter.
    4. Does it work on a metered connection and a shared laptop? Data cost is a real constraint, and a desktop tool that works offline is worth more here than a cloud tool that does not.

    1. Zotero — the recommendation

    Zotero is free and open source, and it wins on the first criterion decisively.

    Its own documentation describes a Style Manager that shows installed styles and their last-updated dates, a link to download more from the Zotero Style Repository, and — the important part — the ability to “install a local Citation Style Language (CSL) style file by clicking the ‘+’ button”. It also documents a Style Editor and a Style Preview window for testing how your references will look before you commit.

    That local-file capability is the answer to the Nigerian house-style problem. If your department publishes a format that is not standard APA, a CSL style for it can be written or adapted and installed, and then every reference in your project renders that way automatically. No web generator on this list can do that.

    Zotero’s documentation also confirms word processor plugins for Microsoft Word and LibreOffice, so citations go into the document rather than being pasted in. And it has one option worth knowing about before it confuses you: “Include URLs of paper articles in references”, which when unchecked means Zotero only adds a URL for journal, magazine and newspaper articles that have no page range.

    Where it falls short: there is a genuine learning curve, and it renders whatever metadata you gave it. Importing a record automatically and never checking it is the commonest way a Zotero user still ends up with a wrong reference.

    How Zotero compares with Mendeley on storage, syncing and group libraries is set out in the Mendeley versus Zotero comparison for Nigerian students.

    A Nigerian student adding a journal article record to a reference library on a laptop beside the printed article
    Enter the record once, correctly, the first time you open the source. Everything downstream is rendering.

    2. Mendeley — the named runner-up

    Mendeley is on the CSL list, has a free tier, and inserts citations into your document through its own word processor plugin. For a student who finds Zotero’s interface unfriendly, it does the core job.

    Where it falls short: it is cloud-centred by design, which matters on a metered connection, and custom-style support is more limited than Zotero’s. Choose it because you prefer it, not because it does more.

    3. ZoteroBib — for the student with no laptop of their own

    ZoteroBib is on the CSL list and needs no installation. If you are working on a shared or borrowed machine and cannot install software, it produces a correctly styled bibliography in a browser.

    Where it falls short: no permanent library, no custom styles, no document integration. It is a tool for producing a list, not for running a project.

    4. The web generators

    Cite This For Me, EasyBib, Scribbr’s citation generator, MyBib, BibGuru and Citationsy all appear on the CSL project’s list of software that uses its styles, so their APA 7th output starts from the same definition.

    They are genuinely convenient for one-off references, and there is nothing wrong with using one that way.

    Where they fall short: no house-style support, no document integration, and — the failure mode that actually costs marks — they encourage a workflow where you generate each reference at the end from a half-remembered source rather than capturing it when you read the paper. That is when issue numbers go missing and page ranges get guessed.

    5. General chatbots — last, and not marginally

    Chatbots are not on the CSL list because they are not running a style engine. They produce text that resembles a reference, which is a different thing.

    Two failure modes, both serious. They format from a pattern rather than a rule, so they drift. And far worse, they fabricate references outright — plausible authors, plausible journals, plausible years, indistinguishable from real entries until somebody searches. Nigerian supervisors check this routinely and it takes seconds. The wider question of where these tools do and do not belong is covered in the article on whether you can use AI to write your final year project.

    The four APA 7th rules generators still get wrong

    Whichever tool you use, check these four. All are stated in APA’s own free Reference Guide for Journal Articles, Books, and Edited Book Chapters, and all four appear regularly in Nigerian project reference lists.

    1. No publisher location. APA’s guide says to include the publisher name followed by a period and to not include the publisher location. “Ibadan: University Press” or “New York, NY: Wiley” is a 6th-edition habit. This is the single most common carry-over error.
    2. No period after the DOI. The guide states plainly: do not put a period after the DOI or URL. Word’s autocorrect and manual typing both add one.
    3. An en dash in page ranges, with no spaces. “59–82”, not “59-82” and not “59 – 82”.
    4. No database information for works from academic research databases. The guide says not to include a URL or database information for such works. A reference ending “Retrieved from JSTOR database” is wrong in APA 7th.

    A correctly formatted APA 7th journal reference, for comparison:

    Guest, G., Bunce, A., & Johnson, L. (2006). How many interviews are enough? Field Methods, 18(1), 59–82. https://doi.org/10.1177/1525822X05279903

    Note the inverted names, the sentence-case article title with no quotation marks, the en dash, and the absence of a full stop at the end.

    A printed reference list with entries circled in red pen and correction notes written in the margin
    Print the list once and read it against the four rules. Fifteen minutes, and it is the cheapest mark recovery in the whole project.

    Before any of this: find out what your department requires

    Everything above assumes APA. That assumption is not safe in a Nigerian university, where referencing requirements are set at department or faculty level and differ widely — including departments that mandate their own house format. Which style applies to you, and how to establish it, is set out in the guide to referencing your project the way your Nigerian university actually requires.

    Do that first. Choosing a tool before knowing the target is how students format a list twice.

    The recommendation

    Install Zotero, add every source as a record the first time you open it, check the record fields, and let the style engine render the list. It is free, it works offline, it inserts citations into Word or LibreOffice, and it is the only option here that can take a department house style as a local CSL file.

    The runner-up for a student on a shared machine who cannot install anything: ZoteroBib, which produces a correct bibliography in a browser at no cost, with the trade-off that nothing is saved between sessions.

    And whichever you choose, the decisive habit is not the tool. It is capturing the source when you read it rather than reconstructing it at the end — which is also what keeps your Chapter Two defensible, as set out in the guide to writing Chapter Two.

    Keep the citation attached to the source you opened

    Tesify keeps every citation attached to the source you actually opened as you draft, so your reference list is assembled from records rather than rebuilt from memory the week before submission. Over 9,000 students have used it to write more than 15,000 chapters, and 100 per cent of the work is still written by you. Current pricing, including what you can do before paying anything, is listed on the Tesify site.

    Build your references in Tesify

    Frequently asked questions

    What is the best citation generator for APA style?

    Zotero, on the criteria that matter for a final year project: it is free, it installs custom styles from a local CSL file, and it inserts citations directly into Word or LibreOffice. Most web generators produce comparable APA output because they draw on the same open style repository, but none of them can hold a department house style.

    Why do different generators produce identical references?

    Because many of them use the same engine. The Citation Style Language project maintains a repository of over 10,000 free styles and publishes a list of the software that uses them, which includes Cite This For Me, EasyBib, Scribbr, MyBib, BibGuru, Citationsy, Mendeley, ZoteroBib and Zotero.

    Is a free citation generator good enough for a final year project?

    For individual references, usually yes. For a whole project it is the wrong shape of tool, because it does not keep your library, does not go into your document, and cannot produce a non-standard departmental format.

    What is the most common APA 7th error in Nigerian projects?

    Including the publisher’s location. APA’s own reference guide says not to include it, but 6th-edition habits and older templates keep reintroducing “City: Publisher”.

    Should I put a full stop after the DOI?

    No. APA’s guide states explicitly not to put a period after the DOI or URL. Check the end of every reference in your list, because typing habits add one.

    Can I use ChatGPT to generate my references?

    No. Chatbots fabricate references that look entirely ordinary until somebody searches for them, and a Chapter Two with unresolvable references casts doubt on everything else in the document. Use them to explain a rule if you like; never to supply a source.

    What if my department has its own referencing format?

    That is exactly the case a reference manager handles and a web generator does not. Zotero’s documentation describes installing a local CSL style file, which means a departmental format can be defined once and applied to the whole project.

    Do I still need to check what the tool produces?

    Yes. Every tool renders the metadata you gave it, so a record with a missing issue number or a mistyped year produces a wrong reference no matter how good the style engine is. Check the record, not just the output.

    Does a citation generator help with in-text citations?

    Only if it integrates with your word processor. Reference managers insert both the in-text citation and the matching list entry and keep them synchronised; a web generator gives you the list entry alone.

    How much mobile data do these use?

    A desktop reference manager is light if you keep file syncing off and sync only bibliographic records rather than PDFs. Web generators need a connection every time you use one, which adds up across a few hundred references.

    Which one should our project group use?

    All of you should use the same one, and agree on it before anyone starts reading. Four members using four tools and merging the list by hand at the end is the outcome that produces the worst reference section, regardless of which tools they were. How the tool choice sits alongside the rest of the workflow is covered in the ranking of AI and academic writing tools for a Nigerian final year project.
  • Graduate Unemployment in Nigeria: The Figures Your Chapter One Should Actually Cite (2026)

    Graduate Unemployment in Nigeria: The Figures Your Chapter One Should Actually Cite (2026)

    Nigerians with advanced education faced 9.2% unemployment in 2024, against a national rate of 3.04% in the same year — roughly three times higher.

    That inversion is the single most useful labour-market fact a Nigerian final year project can carry, and almost no Chapter One states it. Most quote a general unemployment figure, often a double-digit one from an older series, and never separate graduates from the labour force as a whole.

    Every figure below was read directly from the World Bank indicator API on 18 August 2026. Each series carried a lastupdated stamp of 13 July 2026, which is the date to cite alongside the number.

    The headline figures

    Indicator Latest value Year Source
    Unemployment with advanced education (% of labour force with advanced education) 9.2% 2024 World Bank, SL.UEM.ADVN.ZS (updated 13 Jul 2026)
    Unemployment, total (modelled ILO estimate) 3.04% 2024 World Bank, SL.UEM.TOTL.ZS (updated 13 Jul 2026)
    Unemployment, total (national estimate) 3.45% 2024 World Bank, SL.UEM.TOTL.NE.ZS (updated 13 Jul 2026)
    Youth unemployment, ages 15–24 (modelled ILO estimate) 5.09% 2024 World Bank, SL.UEM.1524.ZS (updated 13 Jul 2026)

    Read the first two rows together. Whatever you believe about the absolute level, the ratio is the finding: education does not shield you from unemployment in the Nigerian labour market on these figures — it is associated with a rate three times the national one.

    That is a rationale for an enormous number of Nigerian project topics: graduate employability, entrepreneurship education, skills mismatch, curriculum relevance, industrial training. If your project sits in any of those areas, this is your background paragraph.

    The graduate series, year by year

    Year Unemployment with advanced education (%)
    2016 14.51
    2019 11.16
    2022 6.72
    2023 6.17
    2024 9.20

    Note two things a careful supervisor will notice. The series is gappy — there are no values for 2017, 2018, 2020, 2021 or 2025 — so you cannot draw a continuous line through it. And it moves substantially between adjacent published years, rising from 6.17% to 9.20% between 2023 and 2024.

    Quote individual years with their year attached. Do not describe this as a trend.

    A recent Nigerian graduate scrolling job listings on a laptop with a printed CV beside the keyboard
    The graduate rate and the national rate are different measures of different populations. Most Chapter Ones cite only the second.

    🔴 Why the number you remember is much higher

    If you have a Nigerian unemployment figure in your head, it is probably in double digits, and you will find double-digit figures throughout the literature you are about to cite. Here is what the series actually shows.

    Year Modelled ILO estimate (%) National estimate (%)
    2014 3.90 4.56
    2016 4.50 7.06
    2017 4.83 8.39
    2019 5.21 4.45
    2020 5.71
    2021 5.40
    2022 3.83 3.83
    2023 3.07 3.07
    2024 3.04 3.45
    2025 3.06

    Two features matter for your manuscript.

    The national estimate breaks. It reports 8.39% in 2017 and 4.45% in 2019, then 3.07% in 2023. A halving and more, with gaps in between. A series that moves like that has had something change in how it was produced.

    The two series diverge and then converge. In 2017 the modelled and national estimates were 4.83% and 8.39% — nearly two-fold apart. By 2022 and 2023 they report identical values. Two measures agreeing exactly, after years of disagreeing substantially, is itself a signal about the underlying source.

    This article does not assert why. Nigeria’s national statistics office would be the place to check, and nigerianstat.gov.ng refused the connection entirely when this article was prepared — not a 403, no response at all. So the cause is not stated here, because it could not be verified, and you should not accept it from a secondary source either.

    What you can and should do is state precisely what you are citing:

    Nigeria’s unemployment rate stood at 3.04% in 2024 (World Bank, SL.UEM.TOTL.ZS, modelled ILO estimate, updated 13 July 2026), while unemployment among those with advanced education was 9.2% in the same year (World Bank, SL.UEM.ADVN.ZS). Figures on earlier national bases are substantially higher and are not directly comparable.

    That sentence cannot be broken by a panellist opening the dataset, because it says exactly which series, which year and which basis. “Nigeria’s unemployment rate is 33%” can be broken in about fifteen seconds.

    Reading older literature without importing its numbers

    You will cite Nigerian studies from 2018 to 2023 that quote unemployment figures far above these. That is not a reason to avoid them, and it is not a reason to repeat their numbers as current.

    The convention that works:

    1. Cite the study for its findings, which are about its respondents and remain valid.
    2. Attribute any figure to the study’s own year and basis — “Adeyemi (2021) reported an unemployment rate of X per cent, on the basis then in use”.
    3. Use the current series for any claim you make in your own voice, with the year and indicator attached.
    4. Say once, explicitly, that the bases differ, so a reader does not think you have contradicted yourself.

    That fourth step is the one students skip, and it is what turns an apparent inconsistency into evidence of care. The synthesis method that keeps this straight across a whole chapter is in the guide to writing Chapter Two.

    Youth unemployment is a different population again

    Year Youth unemployment, ages 15–24 (%)
    2019 10.42
    2020 10.84
    2021 8.99
    2022 6.02
    2023 5.13
    2024 5.09
    2025 5.34

    Students routinely use “youth unemployment” and “graduate unemployment” interchangeably. They are not the same measure. The 15–24 age band includes people who never entered tertiary education and excludes most people who completed a degree and a service year, so it is the wrong series for a project about graduates.

    Use SL.UEM.ADVN.ZS for graduates. Use the youth series only if your study is actually about young people as an age group.

    A printed statistical table with figures highlighted and the year column marked in pen beside a calculator
    Mark the year column before you quote anything. Most citation errors in a Chapter One are year errors, not arithmetic ones.

    🔴 What the World Bank does not have for Nigeria

    This is worth stating so you stop searching, and it is a finding in its own right.

    Checked live on 18 August 2026, the World Bank publishes for Nigeria:

    • No tertiary gross enrolment ratio at all (SE.TER.ENRR returns no values).
    • No tertiary graduate count (SE.TER.GRAD returns no data).
    • No tertiary enrolment total (SE.TER.ENRL returns no values).
    • No tertiary pupil–teacher ratio (SE.TER.ENRL.TC.ZS returns no values).

    So there is no national graduation rate to cite from this source, and a project that needs one has to say so rather than substitute something adjacent.

    One tertiary indicator does return values, and it is a cautionary example rather than a usable figure. Educational attainment, at least a bachelor’s degree (SE.TER.CUAT.BA.ZS), reports: 2021 10.97% · 2022 3.48% · 2023 3.80% · 2024 10.57%. A measure of completed degrees cannot fall by two-thirds and then triple in three years. That is survey-to-survey variation, not the world changing, and it must never be quoted as a trend or as a point estimate without that caveat.

    For institution counts and enrolment, use the Nigerian sources instead — the register is covered in how many universities there are in Nigeria and enrolment in how many university students Nigeria has. Admissions are covered in the article on JAMB’s 2026 minimum admission scores.

    How to check any of this yourself

    The World Bank indicator API is open, needs no key, and returns JSON in a browser:

    https://api.worldbank.org/v2/country/NG/indicator/SL.UEM.ADVN.ZS?format=json&date=2014:2026

    Swap the code for SL.UEM.TOTL.ZS, SL.UEM.TOTL.NE.ZS or SL.UEM.1524.ZS to reproduce every table here. The response carries a lastupdated field, which is the date you cite.

    Run the query yourself rather than copying a figure from another project. It takes a minute, it gives you the current value, and it means you can answer “where did that number come from?” with a URL instead of a shrug — which is exactly the kind of question a project defence produces. The same discipline applies to the connectivity figures in student internet access in Nigeria.

    Keep every figure attached to the source you opened

    Tesify keeps citations attached to the sources you actually opened while you draft, so a background section built on national statistics can be traced line by line when a panel asks where a number came from. Over 9,000 students have used it to write more than 15,000 chapters, and 100 per cent of the work is still written by you.

    Draft your Chapter One in Tesify

    Frequently asked questions

    What is the graduate unemployment rate in Nigeria?

    Unemployment among those with advanced education was 9.2% in 2024, according to World Bank indicator SL.UEM.ADVN.ZS as updated on 13 July 2026. That is roughly three times the national rate of 3.04% in the same year.

    Why is the national rate so much lower than I expected?

    The published series reports 3.04% for 2024 on the modelled ILO estimate and 3.45% on the national estimate, while earlier years on the national basis are much higher — 8.39% in 2017. Something changed in how the figure is produced. This article does not assert what, because Nigeria’s national statistics office could not be reached to verify it.

    Can I still cite the higher figures from older studies?

    Yes, attributed to their own year and basis. Cite the study for its findings, attach the year to any figure you take from it, and use the current series for claims you make in your own voice. Say once that the bases differ.

    Is youth unemployment the same as graduate unemployment?

    No. The youth series covers ages 15 to 24 regardless of education and was 5.09% in 2024. Most graduates are outside that band by the time they finish, and most of the band never entered university. Use the advanced-education series for graduates.

    What is a modelled ILO estimate?

    A figure produced on a harmonised international basis so that countries can be compared, as distinct from the national estimate reported on a country’s own definitions. The World Bank publishes both for Nigeria, and they have not always agreed.

    Is there a national graduation rate for Nigerian universities?

    Not from the World Bank. Its tertiary graduate, enrolment and gross enrolment ratio indicators all return no data for Nigeria. A project needing a graduation rate has to say the figure is unavailable rather than substitute an adjacent measure.

    Can I use the educational attainment indicator?

    Not as a point estimate or a trend. It reports 10.97% for 2021, 3.48% for 2022, 3.80% for 2023 and 10.57% for 2024, which is survey variation rather than real change. If you use it at all, quote a single year and state the volatility explicitly.

    How do I cite the World Bank in APA 7th?

    Treat it as a dataset with the World Bank as author, the indicator name as the title, the year, and the indicator or API URL. Do not put a period after the URL.

    Where do these figures belong in my project?

    Background of the study in Chapter One, where they establish the problem your project addresses. They do not belong in Chapter Four, which reports your own data. The section-by-section structure is in the guide to writing Chapter One, and the future-tense version for a proposal is in the guide to writing a research proposal.

    How often do these figures change?

    The World Bank restates its series periodically, and values are revised as well as extended. Re-run the query rather than reusing a figure saved earlier in the session — the gaps and jumps in these tables show exactly why.

    Should I use a percentage or an absolute number?

    Percentages, because these indicators are published as rates and converting them to headcounts requires a labour force denominator you would have to source separately and date consistently. A rate with its year and indicator is defensible; a derived headcount usually is not.

  • Student Internet Access in Nigeria: What the NCC Data Actually Shows (2026)

    Student Internet Access in Nigeria: What the NCC Data Actually Shows (2026)

    Nigeria’s active internet subscriptions fell by 24,556,331 in a single year, a drop of 14.98 per cent — while the volume of data consumed over the same networks rose 34.26 per cent. Both figures come from the same report, both are correct, and neither means what a casual reader would assume. Understanding why is the difference between a citable paragraph and one a panel dismantles.

    The source, and its vintage

    The figures below come from the Nigerian Communications Commission’s 2024 Subscriber/Network Performance Report, a 79-page document produced by its Policy, Competition and Economic Analysis Department and collated from returns submitted by licensed operators, alongside data from the National Bureau of Statistics, the National Population Commission and the Central Bank of Nigeria. It reports the position as at December 2024.

    State that reporting date every time you cite it. A figure quoted without its date is not evidence, and December 2024 is the reference point for everything that follows.

    The headline indicators

    Indicator December 2023 December 2024 Change
    Active subscriptions 224,713,710 164,926,599 −26.61%
    Teledensity 103.66% 76.08% −26.61%
    Active internet subscriptions 163,838,439 139,282,108 −14.98%
    Broadband penetration 43.71% 44.43% +1.64%
    Data consumed 7,272,020.26 TB 9,763,595.18 TB +34.26%

    Source: NCC, 2024 Subscriber/Network Performance Report.

    Why the subscriber numbers fell, and why it is not what it looks like

    Nearly sixty million active subscriptions disappeared from Nigeria’s networks in 2024. Almost no Nigerian lost telephone service.

    The Commission attributes the decline to two things. The first is its NIN-SIM integration policy, under which SIMs not linked to a verifiable National Identification Number were removed from the count. The second, which is easy to miss and important, is what the report calls “the rectification of a major discrepancy by a Mobile Network Operator” — in plain terms, one operator’s numbers had been wrong and were corrected.

    So the fall is overwhelmingly a measurement event, not a connectivity event. The count changed because the counting rule and the counting error changed. Teledensity fell by exactly the same 26.61 per cent for exactly the same reason, since it is derived from the same subscription base.

    Any student who writes “internet access in Nigeria collapsed in 2024” has read the number and not the paragraph beneath it. Any student who writes “the reported subscription base fell in 2024 following the removal of SIMs not linked to a verified National Identification Number and the correction of one operator’s returns (NCC, 2024)” has written something defensible.

    The tell that proves it: usage went up

    The cleanest evidence that Nigerians did not go offline is in the same report. Total data consumed rose from 7,272,020.26 terabytes in 2023 to 9,763,595.18 terabytes in 2024, an increase of 34.26 per cent.

    Fewer counted subscriptions, substantially more data moved. That combination is only consistent with a cleaner count of real users who are using more data, not with a country losing access. This is the kind of internal cross-check that makes a literature review paragraph strong: you are not asserting an interpretation, you are showing that two indicators from one source constrain it.

    A Nigerian student on a hostel balcony holding a phone up for signal with a laptop on their knees
    Coverage is a property of the network. Access is a property of a student’s budget, device and location.

    Coverage: high, and not the same thing as access

    The report gives population coverage as at December 2024:

    Technology Population covered
    2G 95.31%
    3G 89.42%
    4G LTE 84.60%
    5G 13.28%

    Source: NCC, 2024 Subscriber/Network Performance Report.

    Broadband penetration stood at 44.43 per cent in December 2024, up from 43.71 per cent a year earlier. The report also plots the series back through 2020: 45.02 per cent (2020), 40.88 per cent (2021), 47.36 per cent (2022), 43.71 per cent (2023) and 44.43 per cent (2024), against a stated 2025 target of 70 per cent. Note that the series does not rise monotonically — if your project needs a trend, plot all five points rather than picking two.

    The distinction that matters for a research design: coverage measures where a signal exists. It does not measure whether a student can afford data, owns a device capable of using 4G, or has power to charge it. A campus can sit inside the 84.60 per cent 4G footprint and still contain students who are effectively offline for the last week of every month. If your project is about student access, coverage is context, not evidence.

    What the NCC report does not contain — and this is the point

    The report is a subscriber and network performance report. It is organised by operator category: mobile network operators, fixed telephony, internet service providers, collocation and infrastructure providers, and value added service licensees.

    It contains no breakdown by occupation, and therefore no student figure. There is no “internet access among Nigerian university students” line in it, because that is not what the instrument measures. Nor does it break subscriptions down by state, by age, or by institution.

    This is worth knowing before you build a chapter around it, because it forecloses a common and doomed research design: a study whose Chapter Four intends to compare “national student internet access” against a locally collected sample. There is no national student figure to compare against. Attempting one produces either a fabricated number or a comparison between two things that are not comparable.

    What you can legitimately do:

    1. Use the national indicators as context in Chapter One, correctly attributed and dated, to establish that the environment your study sits in is a mobile-first one with high 2G and 3G coverage and a 44.43 per cent broadband penetration rate.
    2. Collect your own student-level data in Chapter Three, and present it as institution-specific rather than national. A well-collected faculty-level figure is worth more than a misapplied national one, and it is defensible because you can explain how it was gathered.
    3. Use the operator-category structure if your topic is the industry rather than the students: the report gives 2024 industry revenue of ₦7,674,131,158,206.77, up 44.70 per cent year on year, with the internet service provider segment accounting for ₦165,690,191,444.41 of it, against industry capital expenditure of ₦2,900,124,568,394.02 and operating costs of ₦5,854,257,451,225.71.

    How to state and source a population and a sample properly, once you have decided to collect your own, is set out in the guide to writing Chapter Three.

    Nigerian students clustered around a phone under a campus tree sharing a mobile hotspot
    One shared hotspot serving four students is one subscription and four users. The count cannot see that.

    The four errors that cost marks with these figures

    1. Treating subscriptions as people. 139,282,108 is a count of active internet subscriptions, not of Nigerians online. One person may hold several SIMs, and one connection may serve a whole hostel room through a shared hotspot. Never write “139 million Nigerians have internet access”.
    2. Reporting the 2024 fall as a loss of access. It is a change in the counting rule plus a corrected operator return, and the report says so on its own second and third pages.
    3. Treating teledensity as a percentage of people. It is derived from subscriptions against population, which is why it exceeded 100 per cent in 2023. A figure above 100 per cent is a definitional signal that you are not looking at a headcount.
    4. Quoting a figure without its December 2024 date. These indicators move every year and two of them moved sharply. An undated number invites the question you least want.

    How to cite this report in your project

    Cite it as: Nigerian Communications Commission, 2024 Subscriber/Network Performance Report, Policy, Competition and Economic Analysis Department. Give the indicator, the value and the December 2024 reference date in the sentence itself. Format the reference entry in whichever style your department mandates rather than assuming APA, since Nigerian universities differ on this — the position institution by institution is in the guide to Nigerian referencing requirements.

    If your project also needs the size of the student population itself, that comes from a different agency entirely and carries its own vintage problem, set out in the article on how many university students there are in Nigeria. And if your framing is admissions rather than enrolment, the relevant figures are in the article on JAMB’s 2026 minimum admission scores.

    Keep every figure attached to its source and its year

    Tesify helps you draft your chapters with citations attached to the sources you actually opened, so a number in your Chapter One still reconciles with its source months later when a panellist asks where it came from. Over 9,000 students have used it, and every word is still written by you.

    Draft your chapter in Tesify

    Frequently asked questions

    How many Nigerians have internet access?

    The honest answer is that no figure in the NCC report tells you. It reports 139,282,108 active internet subscriptions as at December 2024, which is not a count of people, and broadband penetration of 44.43 per cent, which is a separate derived indicator.

    Why did Nigeria’s subscriber numbers fall so sharply in 2024?

    The Commission attributes the fall to the NIN-SIM integration policy, which removed SIMs not linked to a verifiable National Identification Number, and to the correction of a major discrepancy in one mobile network operator’s returns.

    What is broadband penetration in Nigeria?

    44.43 per cent as at December 2024, up from 43.71 per cent in December 2023. The report shows the series has not risen steadily: it was 45.02 per cent in 2020, 40.88 per cent in 2021 and 47.36 per cent in 2022.

    What percentage of Nigeria has 4G coverage?

    84.60 per cent of the population was covered by 4G LTE as at December 2024, with 3G at 89.42 per cent, 2G at 95.31 per cent and 5G at 13.28 per cent.

    Is there an official statistic for internet access among Nigerian students?

    Not in this report. It disaggregates by operator category rather than by occupation, so it contains no student figure, no age breakdown and no state breakdown.

    Can I use these figures for a study on students then?

    Yes, as environmental context in your background section, correctly dated. For student-level evidence you will need to collect your own data and present it as institution-specific.

    How much data do Nigerians consume?

    9,763,595.18 terabytes in 2024, up from 7,272,020.26 terabytes in 2023, an increase of 34.26 per cent.

    Why was teledensity above 100 per cent in 2023?

    Because it is derived from active subscriptions rather than from individual people, and one person can hold several SIMs. It stood at 103.66 per cent in December 2023 and 76.08 per cent in December 2024.

    Is the 2024 report the most recent one?

    It is the most recent year-end performance report this article was able to verify at the Commission’s own document host in August 2026. Check for a newer edition before you cite, and if you find one, cite that instead with its own reference date.

    What should I do if the agency’s website will not open for me?

    Try again later, try a different network, and try the document link directly rather than the site’s navigation. A website that will not load for you is not evidence about the agency or about the state of Nigerian connectivity, and it must never be written into a project as a finding.

  • How to Write Chapter Four of a Final Year Project in Nigeria: Data Presentation, Analysis and Interpretation (2026)

    How to Write Chapter Four of a Final Year Project in Nigeria: Data Presentation, Analysis and Interpretation (2026)

    Chapter Four is where a final year project stops being reading and starts being evidence. Most Nigerian departments title it Data Presentation, Analysis and Interpretation, and most students write it the same wrong way: they collect the questionnaires, run everything they can think of, paste the output in, and then try to build sentences around whatever appeared.

    The chapter is written one table at a time, in the order of your research questions, and nothing that answers no research question belongs in it. What follows is that procedure in eight steps, with the actual tables and sentences you will need.

    One thing outranks everything below: your department’s project guidelines. Departments at UNILAG, Ibadan, ABU Zaria, OAU and Nsukka differ on table numbering, on whether hypotheses are tested inside Chapter Four or Chapter Five, and on whether a decision rule must be stated in words. Where this guide and your handout disagree, follow the handout.

    Step 1: Rebuild the chapter outline from your research questions

    Output: a numbered sub-section list matching your Chapter One, written before you open any data.

    1. Open Chapter One and copy out the research questions in order, exactly as worded.
    2. Give each one its own sub-heading in Chapter Four, in the same order.
    3. Beside each, note the single table that will answer it.
    4. Add one sub-section per hypothesis, after the research questions.
    5. Delete every piece of output not assigned to a heading.

    Four research questions means four tables plus one per hypothesis. If you have eleven tables, several of them are answering nothing, and a panel member will ask why you ran them. The alignment between what you asked and what you answer is the thing being examined — the same alignment described in the guide to writing Chapter One.

    Step 2: Fix the return rate, and never change the number again

    Output: three counts, and one of them used everywhere afterwards.

    Chapter Four opens by saying how many questionnaires went out, how many came back, and how many were usable. Write it once, plainly:

    “A total of 250 copies of the questionnaire were administered to respondents in the five departments studied. Of these, 236 copies were retrieved and 231 were properly completed and used for the analysis, giving a return rate of 92.4%. The analysis in this chapter is therefore based on 231 respondents.”

    That last number is the one that appears in every table note, in the abstract, and in any percentage you compute. A respondent count that reads 231 in one table and 236 in another is the single most commonly caught defect in Nigerian project defences, and it costs you credibility on every other figure in the chapter. How you arrived at those counts belongs in Chapter Three, not here.

    Step 3: Present the bio-data as a frequency and percentage table

    Output: one table covering the respondent profile, and one short paragraph under it.

    The demographic section is descriptive only. It uses frequency and simple percentage, nothing else.

    Table 1: Distribution of Respondents by Demographic Characteristics

    Variable Category Frequency Percentage (%)
    Sex Male 128 55.4
    Female 103 44.6
    Level 300 Level 74 32.0
    400 Level 92 39.8
    500 Level 65 28.2
    Age Below 25 years 167 72.3
    25 years and above 64 27.7

    Source: Field Survey, 2026. n = 231.

    Two rules. Every block of percentages sums to 100 against your N, so check the arithmetic before the panel does. And keep the paragraph underneath short — the bio-data is context, not a finding, and a page of prose about how many respondents were male tells the reader nothing they cannot see.

    A printed frequency and percentage table with a handwritten interpretation in the margin
    One table, one finding, one paragraph. If you cannot underline the row your paragraph is about, the paragraph is not about anything.

    Step 4: Build the mean table for each research question

    Output: one table per research question, with mean, standard deviation and a decision column.

    Most Nigerian undergraduate instruments use a four-point scale: Strongly Agree 4, Agree 3, Disagree 2, Strongly Disagree 1. The criterion mean is 2.50, because the four scale points average to 2.50 — an item at or above it is Accepted, below it is Rejected. If your department uses a five-point scale, the criterion is 3.00 by the same arithmetic. State whichever you used, and where it came from, in the note under the table.

    Table 2: Effect of Power Supply on Student Study Hours

    S/N Item Mean SD Decision
    1 Irregular power supply reduces my evening study hours 3.42 0.71 Accepted
    2 I rely on a generator or power bank to study at night 3.18 0.84 Accepted
    3 I use the departmental reading room when there is no light at home 2.87 0.92 Accepted
    4 Power supply has no effect on how long I study 1.94 0.88 Rejected
    Grand Mean 2.85 0.84 Accepted

    Source: Field Survey, 2026. n = 231. Criterion mean = 2.50.

    Carry the standard deviation next to every mean. A mean of 3.42 with an SD of 0.71 describes a group that broadly agrees; the same mean with an SD of 1.40 describes a group that is split, and a panel may well ask which one you have. Item 4 above is reverse-worded on purpose — note that it was rejected, which is consistent with the other three rather than contradicting them.

    Step 5: Write the interpretation paragraph, in three moves

    Output: one paragraph under each table that does not simply retype the table.

    If your prose reads “from Table 2 above, item 1 has a mean of 3.42, item 2 has a mean of 3.18, item 3 has a mean of 2.87”, you have transcribed the table and said nothing. Every paragraph needs three moves:

    1. State the finding. The highest and lowest items and the overall picture, in one sentence.
    2. Say what it means in your setting — your department, your campus, your respondents.
    3. Connect it to Chapter Two. One named study your finding agrees or disagrees with.

    Worked paragraph:

    “Table 2 shows a grand mean of 2.85 against a criterion mean of 2.50, indicating that respondents generally agree that power supply affects their study hours. The strongest agreement was on the reduction of evening study hours (M = 3.42, SD = 0.71), while the claim that power supply has no effect was rejected (M = 1.94, SD = 0.88). This suggests that the constraint is felt most acutely at night, which is consistent with the reliance on generators and power banks reported in item 2, and with the departmental reading room serving as the fallback rather than the first choice. Adeyemi (2023) reported a similar pattern among undergraduates in a comparable state university, although the reliance on alternative power sources in the present study is higher.”

    The third move is the one almost always missing, and its absence is why a supervisor writes “no discussion” in the margin. The studies you compare against come from your literature review, and every author you name here must appear in your reference list in the style your department requires — the conventions are in the guide to referencing a Nigerian university project in APA.

    Step 6: Test each hypothesis and write the decision sentence

    Output: one sub-section per hypothesis, each ending in an explicit decision.

    Hypothesis sub-sections have a fixed shape, and panels test it because it is short enough to check line by line. State the hypothesis, present the table, state the decision.

    Worked example:

    Ho₁: There is no significant relationship between power supply and student study hours.

    “The chi-square test returned a calculated value of 18.42 with 4 degrees of freedom at the 0.05 level of significance, against a critical table value of 9.488. Since the calculated value (18.42) is greater than the critical value (9.488), the null hypothesis is rejected. There is therefore a significant relationship between power supply and student study hours.”

    Many Nigerian departments still teach the calculated-versus-critical-value comparison, while statistical software reports a p-value instead. The two agree: a calculated value above the critical value corresponds to a p-value below 0.05. If your output gives you p, the equivalent sentence is “χ²(4, N = 231) = 18.42, p = .001; the null hypothesis is rejected.” Use whichever form your department teaches, and use only one of them throughout the chapter.

    Two wordings a panel will correct on the spot. You reject or fail to reject a null hypothesis — you never accept it and you never prove it. And a significant result is not automatically a large or important one, so the sentence after the decision should say what the relationship means in practice.

    A Nigerian student explaining a results table to a seated project supervisor
    Take the tables to your supervisor before you write the prose. A wrong table costs an afternoon; a chapter written around a wrong table costs a week.

    Step 7: Report the numbers the way the style requires

    Output: one pass over every figure in the chapter.

    Nigerian departments overwhelmingly use APA, and its rules on numbers are narrower than most students realise. From the APA Style numbers and statistics guidance:

    1. Decimal places. Means and standard deviations from an integer scale — your four-point questionnaire — take one decimal in APA’s own convention, although many Nigerian departments require two. Follow your department, but be consistent across every table.
    2. Leading zeros. Include the zero before the decimal point only when the statistic can exceed 1. A correlation, a proportion and a p-value cannot, so write r = .42 and p = .03, not 0.42.
    3. Exact p values to two or three decimals, except below .001, where you write p < .001.
    4. Numerals for 10 and above and for every number used in a statistic; words for zero to nine and for any number that opens a sentence.
    5. Do not repeat a statistic in both the text and a table. Quote only the figures your argument turns on.
    6. Statistical symbols are italicM, SD, r, p, N — and never need defining. ANOVA and CI do.

    Step 8: Reconcile before you submit

    1. Questions equal sub-sections. Four research questions, four sub-sections, same order, same wording.
    2. Tools equal tables. Every tool named in Chapter Three produces a table here, and no table comes from a tool you never named.
    3. One N everywhere. Chapter Three, every table note, and the abstract.
    4. Every table is mentioned by number in the text at least once.
    5. Every hypothesis has a decision stated in words, not just a table.

    Then run the spoken test: can you state each finding in one sentence without looking at the page? That is precisely what you will be asked to do, and the standard inventory of what else gets asked is in the guide to what questions are asked during a project defence. How the whole document fits together is summarised in how many chapters a final year project has.

    You have the data. Now build the chapter.

    Tesify holds your chapters in the structure your department expects and keeps every citation attached to a source you actually opened, so the week after data collection goes into interpretation instead of formatting. Over 9,000 students have used it to write more than 15,000 chapters, and every word is still written by you.

    Build your Chapter Four in Tesify

    Frequently asked questions

    How do I write chapter four of a project?

    Create one sub-section per research question, in the order they appear in Chapter One. Under each, place one table and a paragraph that states the finding, explains it in your setting and compares it with a study from Chapter Two. Then add one sub-section per hypothesis, each ending in an explicit decision.

    What is chapter four of a project called?

    Most Nigerian departments title it “Data Presentation, Analysis and Interpretation” or “Presentation and Analysis of Data”. Check your department’s project guidelines, because the exact wording is usually prescribed.

    What is the criterion mean for a four-point scale?

    2.50, being the average of 4, 3, 2 and 1. An item at or above 2.50 is accepted and one below it is rejected. On a five-point scale the criterion is 3.00.

    How many tables should chapter four have?

    Roughly one per research question, plus one per hypothesis, plus the bio-data table. Most Nigerian undergraduate projects land between five and nine. A chapter with fifteen tables usually means software output was pasted in rather than selected.

    Do I put the standard deviation in the table?

    Yes. The mean alone does not tell the reader whether respondents agreed with each other, and a panel can reasonably ask for the spread. Report it beside every mean.

    Should hypotheses be tested in chapter four or chapter five?

    Chapter Four in most Nigerian departments, with Chapter Five reserved for the summary, conclusion and recommendations. Some departments differ, so follow your handout.

    Can I say I accepted the null hypothesis?

    No. Say you failed to reject it, or that it was not rejected. Not finding evidence of a relationship is not evidence that no relationship exists, and this is corrected in almost every defence where it appears.

    What does the decision rule mean in hypothesis testing?

    It is the stated basis on which you accept or reject: either the calculated value against the critical table value at your degrees of freedom, or the p-value against 0.05. Both are valid; state which you used and use only that one throughout.

    Do I discuss my findings in chapter four or chapter five?

    Where your department says. Many Nigerian projects place a discussion of findings at the end of Chapter Four and keep Chapter Five for the summary and recommendations. What matters is that the discussion exists somewhere and compares your findings with the literature.

    What if my findings contradict the studies in chapter two?

    Report it plainly and explain it from your setting — a different population, a different period, a different instrument. A contradiction that is explained is a contribution; one that is quietly omitted is a defect a panel finds by reading your Chapter Two.

    Do recommendations go in chapter four?

    No. Chapter Four presents and interprets what the data showed. The moment you start telling the department what it should do, you have crossed into Chapter Five.