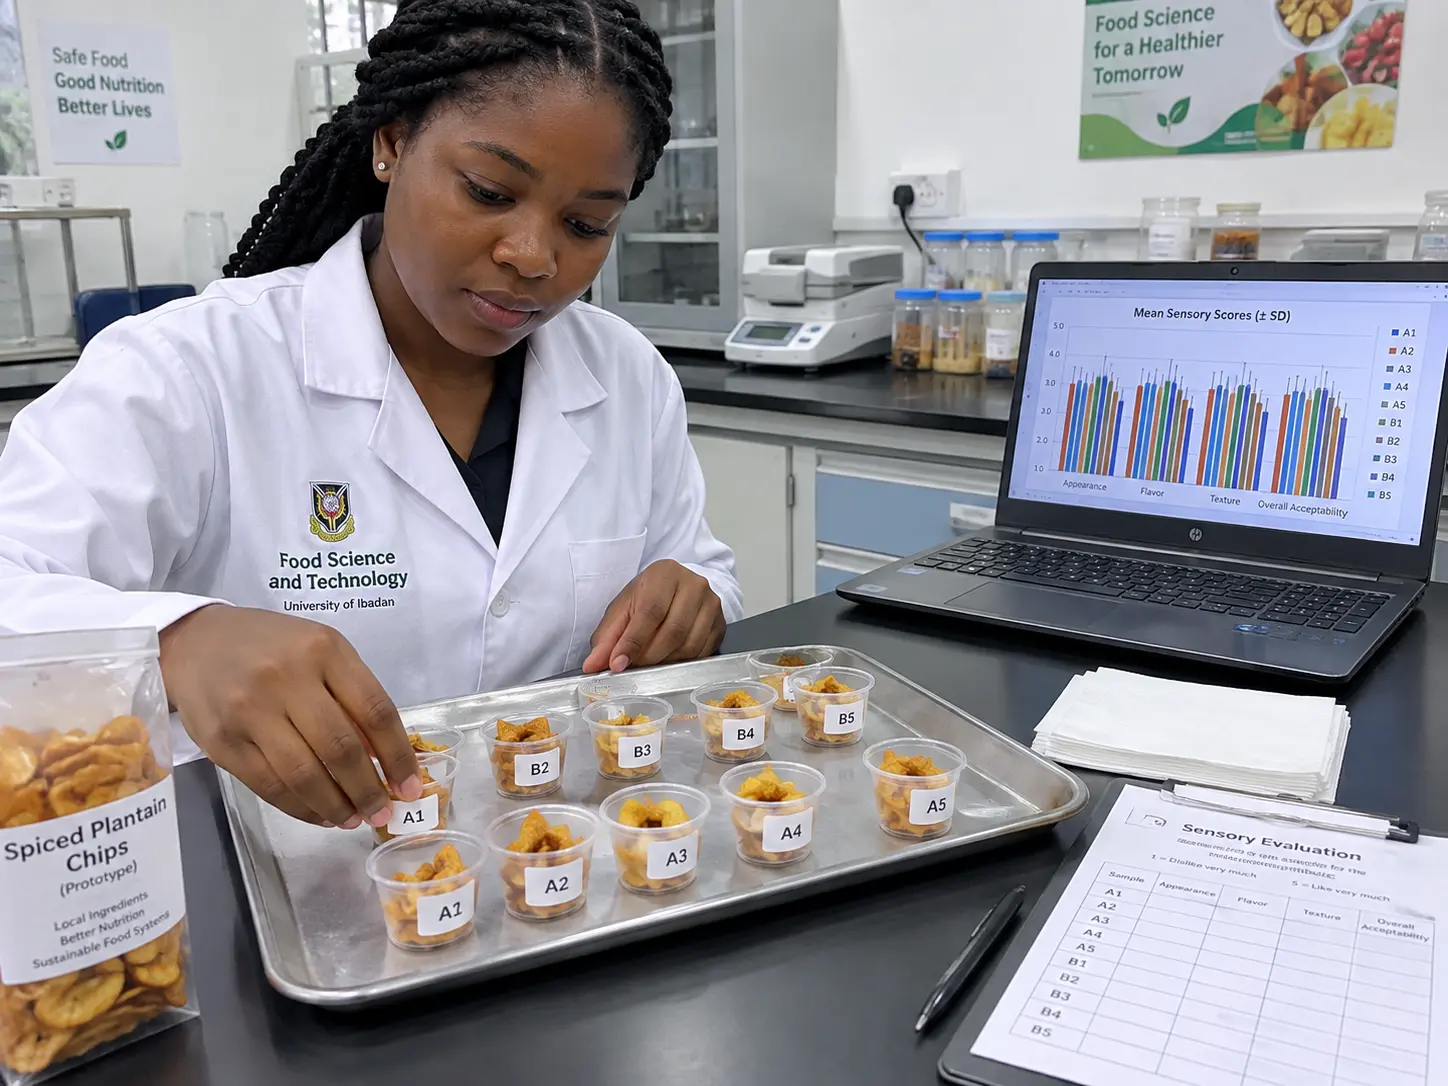
Food science final year projects usually need one of two different kinds of statistical tool, not just “SPSS like everyone else”: a design-of-experiments tool if your project optimises a formulation (Design-Expert or Minitab), and a general statistics tool if your project analyses a sensory panel or consumer survey (SPSS or Excel). The comparison below ranks all four by cost, what they are actually built for, and the learning curve on a typical undergraduate timeline, so you can pick the right one before your lab work starts rather than after your data is already collected in the wrong shape for your chosen software.
| Tool | Cost/licence | Best for | Learning curve |
|---|---|---|---|
| Design-Expert (Stat-Ease) | Paid; no price is shown on the Design-Expert product page, so contact Stat-Ease directly. Free trial and academic licensing options are offered (statease.com) | Formulation optimisation via Response Surface Methodology (RSM) or mixture design | Moderate; purpose-built interface for DOE, but the statistical concepts behind RSM take real study |
| Minitab | Annual subscription — Minitab Solution Center plans are listed at $2,394 (Core), $2,593.50 (Analytics) and $2,793 (Copilot) USD per year (minitab.com/pricing); academic pricing is referenced but not itemised on that page. Free trial available | General statistics, basic DOE, and quality-control charts (useful for shelf-life/stability studies) | Moderate; broader toolset than Design-Expert but less specialised for formulation work |
| SPSS | Licensed, priced per seat or via an institutional/campus licence | Sensory panel and consumer-acceptance survey analysis (ANOVA, post-hoc tests) | Moderate; its output tables are familiar to many supervisors |
| Excel | Free if already licensed via Microsoft 365, otherwise part of a paid Office subscription | Descriptive statistics, small proximate-analysis datasets, simple charts | Low; no learning curve for basic tasks, but no built-in RSM/DOE capability |
Which Tool Fits Your Project Type?
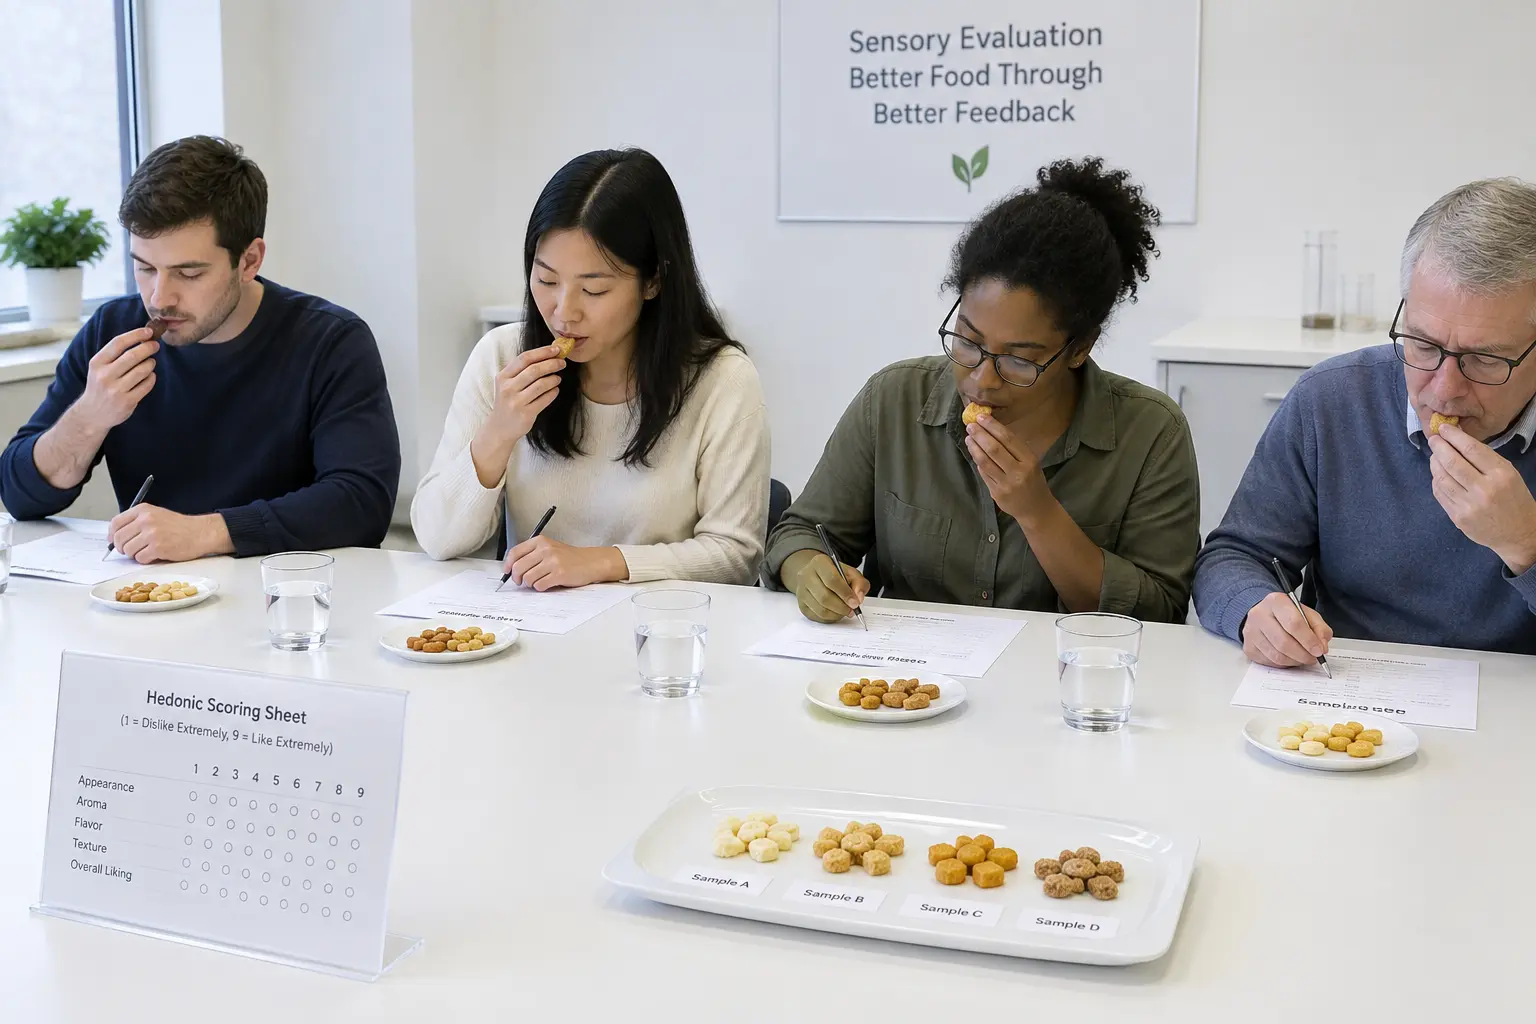
The right tool depends entirely on what your topic actually asks you to do, and this is the decision to make before your data collection starts, not after.
- Formulation or product-development topics (“optimising the ratio of one ingredient to another in a snack, beverage or baked product”) need a design-of-experiments tool. Design-Expert is purpose-built for this — it generates the experimental runs (which combinations of your ingredients to actually test) and then fits the response surface once you have your results. This is a genuinely different job from general statistics software.
- Sensory evaluation and consumer-acceptance topics (a trained or untrained panel scoring taste, texture, appearance on a hedonic scale) need a general statistics tool with ANOVA and post-hoc comparison, which is what SPSS is built for. Excel can handle this too for a smaller panel, with more manual setup.
- Shelf-life and stability studies (tracking a quality attribute over storage time) can use either Minitab’s control-chart and regression tools or Excel’s trendline function for a simpler design, depending on how many storage conditions and time points your design has.
- Proximate composition or nutrient-analysis studies (measuring moisture, protein, fat, ash across samples) are usually simple enough for Excel or a basic SPSS descriptive/ANOVA run, without needing DOE software at all.
A mistake worth naming directly: choosing a tool because it is what a previous cohort’s project used, rather than because it fits your own design, is one of the more common reasons a Chapter Three method section and a Chapter Four analysis section do not actually match. If your proposal describes an optimisation objective but your Chapter Four only reports a one-way ANOVA on a handful of arbitrarily chosen formulations, a panel will notice the mismatch immediately — decide your tool at the same time you finalise your research design, not after your lab work is already done.
Our Recommendation: Match the Tool to the Design, Not to What Other Students Used
If your project is a genuine optimisation topic (finding the best combination of two or three formulation variables), Design-Expert is worth the effort of its free trial — plan your data-collection timeline so your trial window covers your actual analysis phase, since trial access is time-limited rather than indefinite. If your department has an institutional Minitab licence, it is a reasonable substitute for simpler DOE designs and adds useful quality-control charts for shelf-life topics. For anything sensory-panel or survey-based with no optimisation component, SPSS remains the safer default because its ANOVA and post-hoc output is familiar to most supervisors, and Excel is the honest zero-cost option for a smaller, simpler dataset.
Design-Expert in Practice: What an RSM Design Actually Looks Like
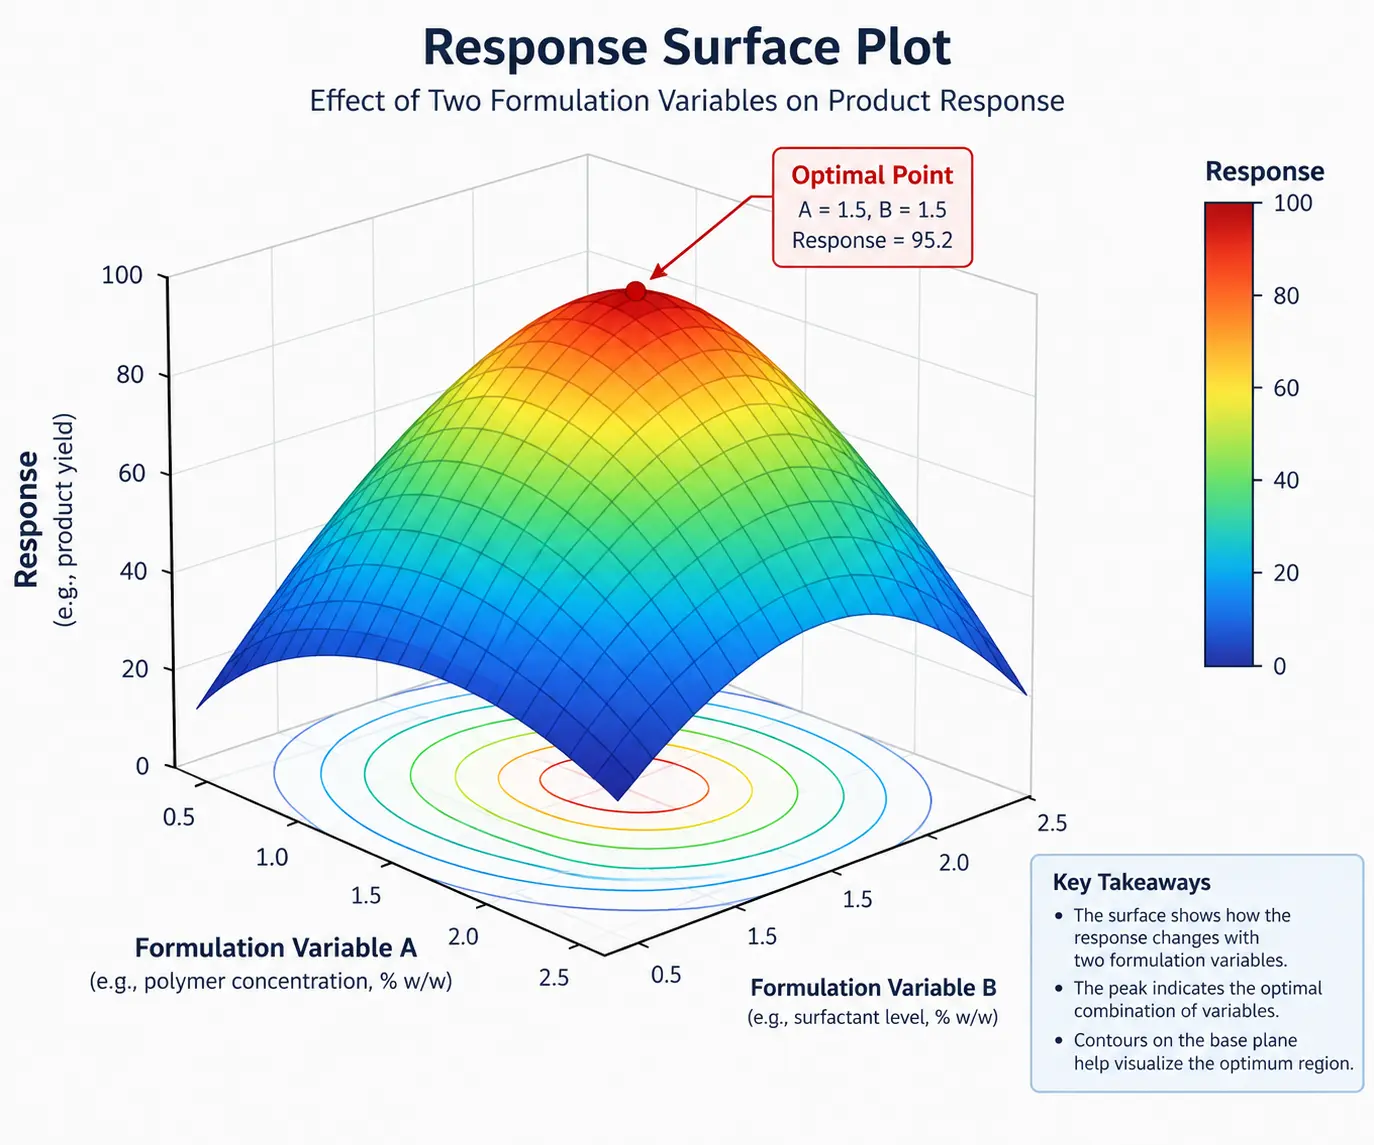
A typical Design-Expert workflow for a food formulation project runs in a fixed order: define your factors (for example, three ingredient proportions) and their tested ranges, let the software generate a central composite or Box-Behnken design specifying exactly which combinations to prepare and test, run those combinations in the lab and record your response variable (a sensory score, a physical property, a yield), then let the software fit a response-surface model and identify the combination that optimises your response. The output includes a model equation, an ANOVA table testing whether the model is statistically significant, a 3D response-surface plot and the predicted optimum combination — all four are expected in a Chapter Four built around this design, and skipping the ANOVA table testing model significance is one of the most common panel objections to an RSM chapter.
A Worked Example: Optimising a Snack Formulation (Illustrative)
The factors, results and optimum below are entirely fictitious and illustrative — built to show the shape of a Design-Expert-based Chapter Four, not to be copied as real findings.
Design paragraph: “This study used a three-factor Box-Behnken design in Design-Expert to optimise the proportions of plantain flour (60–70%), soy flour (15–25%) and sugar (8–12%) in a fortified snack, with overall sensory acceptability (9-point hedonic scale) as the response. Fifteen experimental runs — twelve edge-midpoint combinations and three centre points — were generated by the software and prepared in randomised order.”
| Run | Plantain flour (%) | Soy flour (%) | Sugar (%) | Sensory score (illustrative) |
|---|---|---|---|---|
| 1 | 60 | 15 | 10 | 6.8 |
| 2 | 70 | 15 | 10 | 7.4 |
| 3 | 65 | 25 | 12 | 6.2 |
| … | … | … | … | … |
| 15 | 65 | 20 | 10 | 7.9 |
Results paragraph (illustrative): “The fitted quadratic response-surface model was statistically significant (illustrative F(9, 5) = 8.42, p = 0.015), with plantain flour proportion showing the largest positive effect on sensory acceptability. The model predicted a maximum sensory score of 8.1 at 68% plantain flour, 17% soy flour and 8.5% sugar. A confirmatory run prepared at this predicted optimum produced an actual sensory score of 7.9, within an acceptable margin of the model’s prediction, supporting the validity of the fitted model.”
Common Faults With Formulation-Optimisation Chapters
| Fault | Fix |
|---|---|
| Testing combinations chosen by trial and error instead of a proper experimental design | Let the DOE software generate your run combinations before you start lab work — this is what makes the analysis valid |
| Reporting the “best” combination with no model significance test | Always report the model’s ANOVA (F-value, p-value) alongside the optimum point |
| Skipping model validation (confirming the predicted optimum in a real trial run) | Prepare and test the software’s predicted optimum combination and report how closely the actual result matched the prediction |
| Using DOE software but then analysing results with a plain one-way ANOVA instead of the response-surface model | Use the software’s own model-fitting output, not a separate simplified test that ignores the interaction terms your design was built to capture |
Should You Reference Food Safety Standards in Your Discussion?
If your formulation project produces a food product intended for eventual sale rather than a purely academic prototype, your discussion section should note that any real-world commercialisation would need to meet the National Agency for Food and Drug Administration and Control’s (NAFDAC) relevant registration and labelling requirements — but stop at that general statement unless you have actually opened NAFDAC’s current guideline for your specific product category, since standards and thresholds are revised periodically and a specific numeric limit quoted from memory is exactly the kind of detail that gets corrected at defence. Most undergraduate formulation projects are scoped as a laboratory-stage optimisation study, not a commercialisation-ready product, and stating that scope explicitly in your limitations section is safer than implying regulatory compliance you have not verified.
Frequently Asked Questions
Do I need Design-Expert specifically, or can I use Minitab for my optimisation project?
Minitab can run response-surface and mixture designs too, so either is acceptable — Design-Expert’s interface is more specialised for this specific task, but check whether your department has an existing institutional licence for either before paying for a trial or subscription.
How long does the Design-Expert free trial last?
The exact trial length is set by Stat-Ease and can change, so confirm the current duration on their trial page before planning your data-collection schedule around it, rather than assuming a fixed number of days.
Can I do response-surface methodology in Excel instead?
Not practically — Excel has no built-in DOE generator or response-surface model-fitting tool, so while you could manually compute a simple regression, you would be reconstructing (poorly) what dedicated DOE software already does correctly and with the right diagnostics.
What if my department has no licence for any of these tools?
Ask your supervisor first — your department or faculty computer lab may already have a licensed copy of SPSS or Minitab, and it is worth checking before assuming you need to pay for a personal licence.
Is a free trial acceptable to use for a whole final year project, or do panels object?
Panels generally care about the analysis being correct, not which specific licence type produced it — using a free trial responsibly, timed to your actual analysis phase, is a common and accepted student practice.
Do I need statistical software at all if my project is purely descriptive (just measuring nutrient content once)?
A purely descriptive study with no comparison or hypothesis test can be reported with Excel’s basic functions (means, standard deviations); statistical software becomes necessary once you are comparing groups or testing a model.
How many experimental runs does a typical Box-Behnken or central composite design need?
The exact number depends on how many factors you are testing and which specific design your software selects — a three-factor Box-Behnken design commonly generates around thirteen to fifteen runs including centre-point replicates, but let the software calculate the exact number for your specific factor count rather than assuming a fixed figure.
Can I run a mixture design instead of a factorial response-surface design?
Yes — if your formulation ingredients must sum to 100% (a common constraint in food formulation, since your proportions of flour, sugar and other components together make up the whole product), a mixture design is the statistically correct choice over a standard factorial design, and both Design-Expert and Minitab offer mixture-design modules specifically for this case.
Whichever tool your design needs, writing up the methodology correctly and connecting your results to your research questions is where most Chapter Four marks are actually won or lost. More than 9,000 students have used Tesify to write over 15,000 chapters, and every one is 100% written by you: your design, your results and your discussion remain your own work. Start your project with Tesify and plan your analysis chapter with a clear structure.
For the general statistics decision beyond food science, see SPSS, Excel and JASP compared, and if your project involves any human sensory panel, check what a validated questionnaire or scoring sheet needs to look like before your panel session. Keep your references organised with Mendeley versus Zotero, and for the mechanics of writing up your data chapter once your analysis is done, see how to write Chapter Four of a final year project. If your topic still needs a proper experimental design plan, how to write Chapter Three covers the structure your design section should follow.