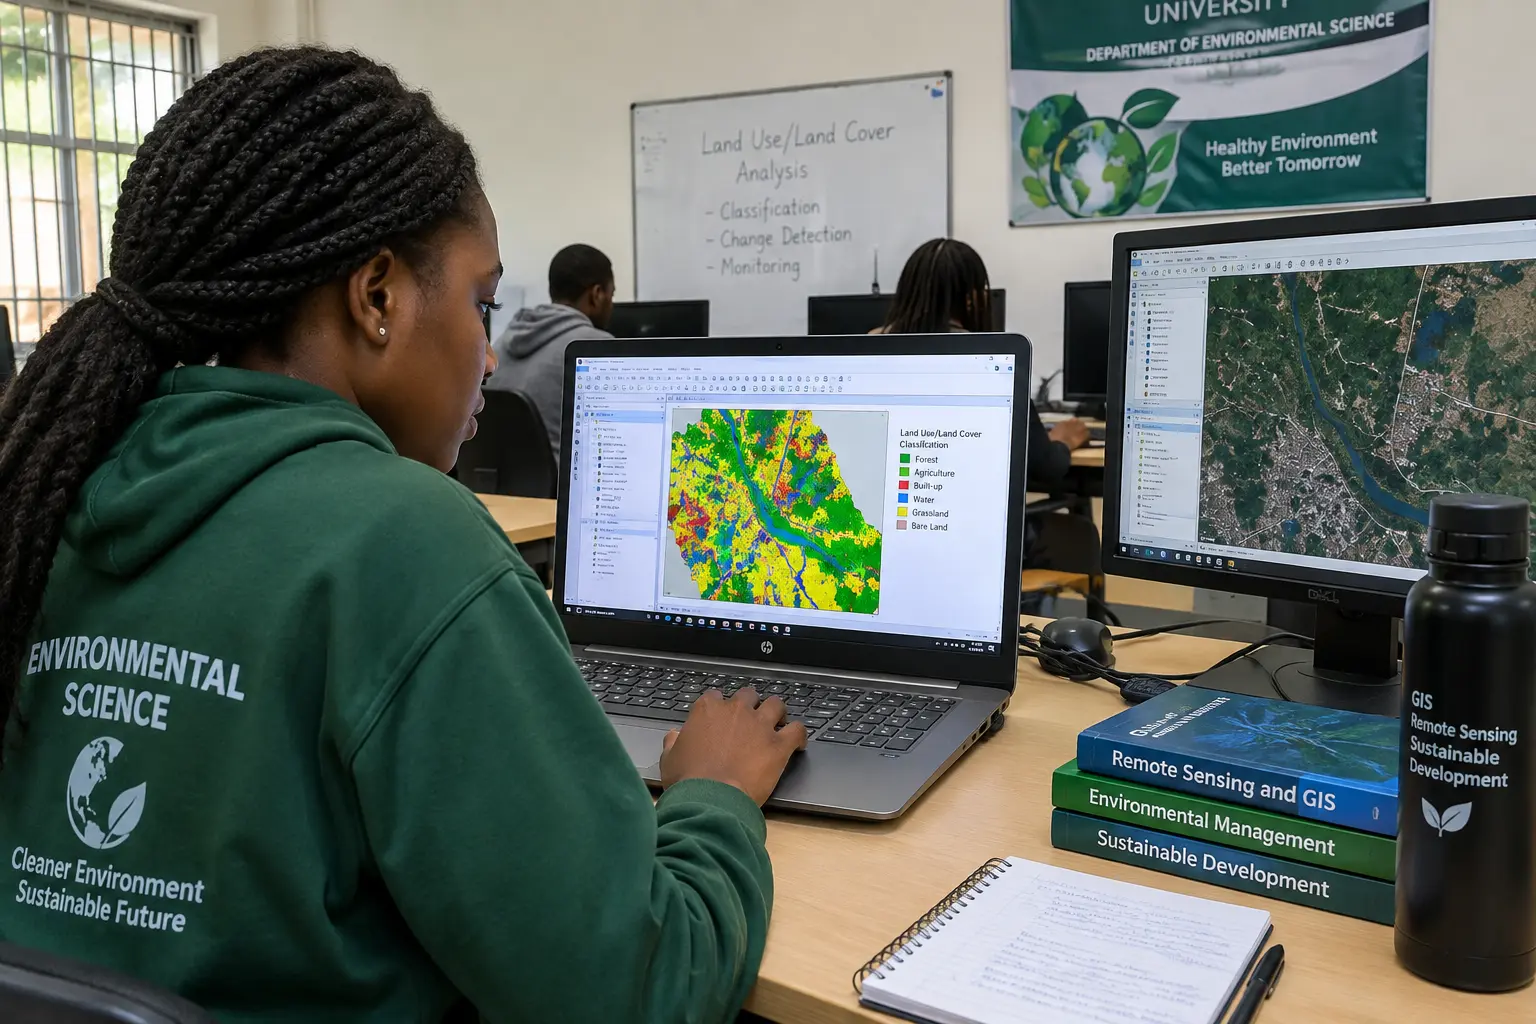
Most Nigerian environmental science final year projects need one mapping/remote-sensing tool, one data-collection tool for fieldwork, and a statistics tool for any survey component — not five different pieces of software. The comparison below ranks the four tools most environmental science projects actually use, by cost, hardware demand and how steep the learning curve is on a typical student laptop, so you can build a realistic tool stack before your data-collection deadline rather than discovering mid-project that your chosen software cannot do what your topic needs.
| Tool | Cost | Best for | Hardware/learning curve |
|---|---|---|---|
| QGIS | Free, open-source | Land-use mapping, spatial overlay, vector/raster GIS analysis | Moderate curve; runs on a mid-range laptop |
| Google Earth Engine | Free for students and staff using it for academic research or learning (noncommercial) | Satellite time-series analysis (deforestation, water-body change, vegetation indices) | Runs in-browser; low local hardware demand, but needs stable internet |
| Esri ArcGIS | Commercial, paid licence; Esri also sells a reduced-price individual ArcGIS for Student Use licence (no price listed on that page) | Advanced cartographic output and enterprise-grade spatial analysis | Steeper curve; industry-standard interface but a real licence-cost barrier for most Nigerian undergraduates |
| SPSS / Excel | SPSS licensed; Excel commonly available via Microsoft 365 | Analysing survey data from an environmental perception or awareness study | Low curve for Excel; moderate for SPSS’s statistical output |
Our Recommendation: QGIS, With Google Earth Engine as the Free Companion Tool
QGIS is the right default for most Nigerian environmental science projects: it is entirely free, has a large community of online tutorials, and produces publication-quality maps your panel will recognise as proper GIS output. Google Earth Engine is the best companion, not a replacement — where your project needs satellite imagery over time (tracking deforestation, flood extent, or urban sprawl across several years) rather than a single static map, Earth Engine’s cloud processing avoids downloading and processing huge satellite scenes on a laptop that cannot handle it. Between the two, most projects need both: QGIS for the final cartographic output, Earth Engine for the heavy imagery processing that feeds into it.
QGIS: The Free GIS Workhorse
QGIS is a free, open-source geographic information system that reads and writes the same shapefile and raster formats as commercial GIS software, which means your project’s output is compatible with what any examiner expects to see. It handles the core tasks most environmental science topics need: overlaying land-use classifications, buffering protected areas, computing area statistics, and producing a labelled, scaled map with a legend and north arrow — standard elements examiners look for on any spatial figure. The learning curve is moderate; expect to spend one or two weeks on tutorials before you can confidently build your own analysis, and budget that time into your project schedule rather than discovering it during your data-analysis phase.
A typical QGIS-based Chapter Four workflow runs in a predictable order: import your base map or satellite scene, digitise or import the boundary of your study area, classify land cover into named categories (built-up, vegetation, water body, bare soil), run a zonal or area calculation to get hectares or square kilometres per category, and export the final map at print resolution with a title, scale bar, north arrow and legend. Each of those five outputs — the classified map, the area table, and the three cartographic elements — is something a panel will look for individually, so treat them as a checklist rather than a single “make a map” task. QGIS also supports plugins that add specific capabilities (the Semi-Automatic Classification Plugin for satellite image classification is a common one for environmental science undergraduates), which is worth exploring once you are comfortable with the core interface.
Google Earth Engine: Free Cloud Processing for Satellite Data
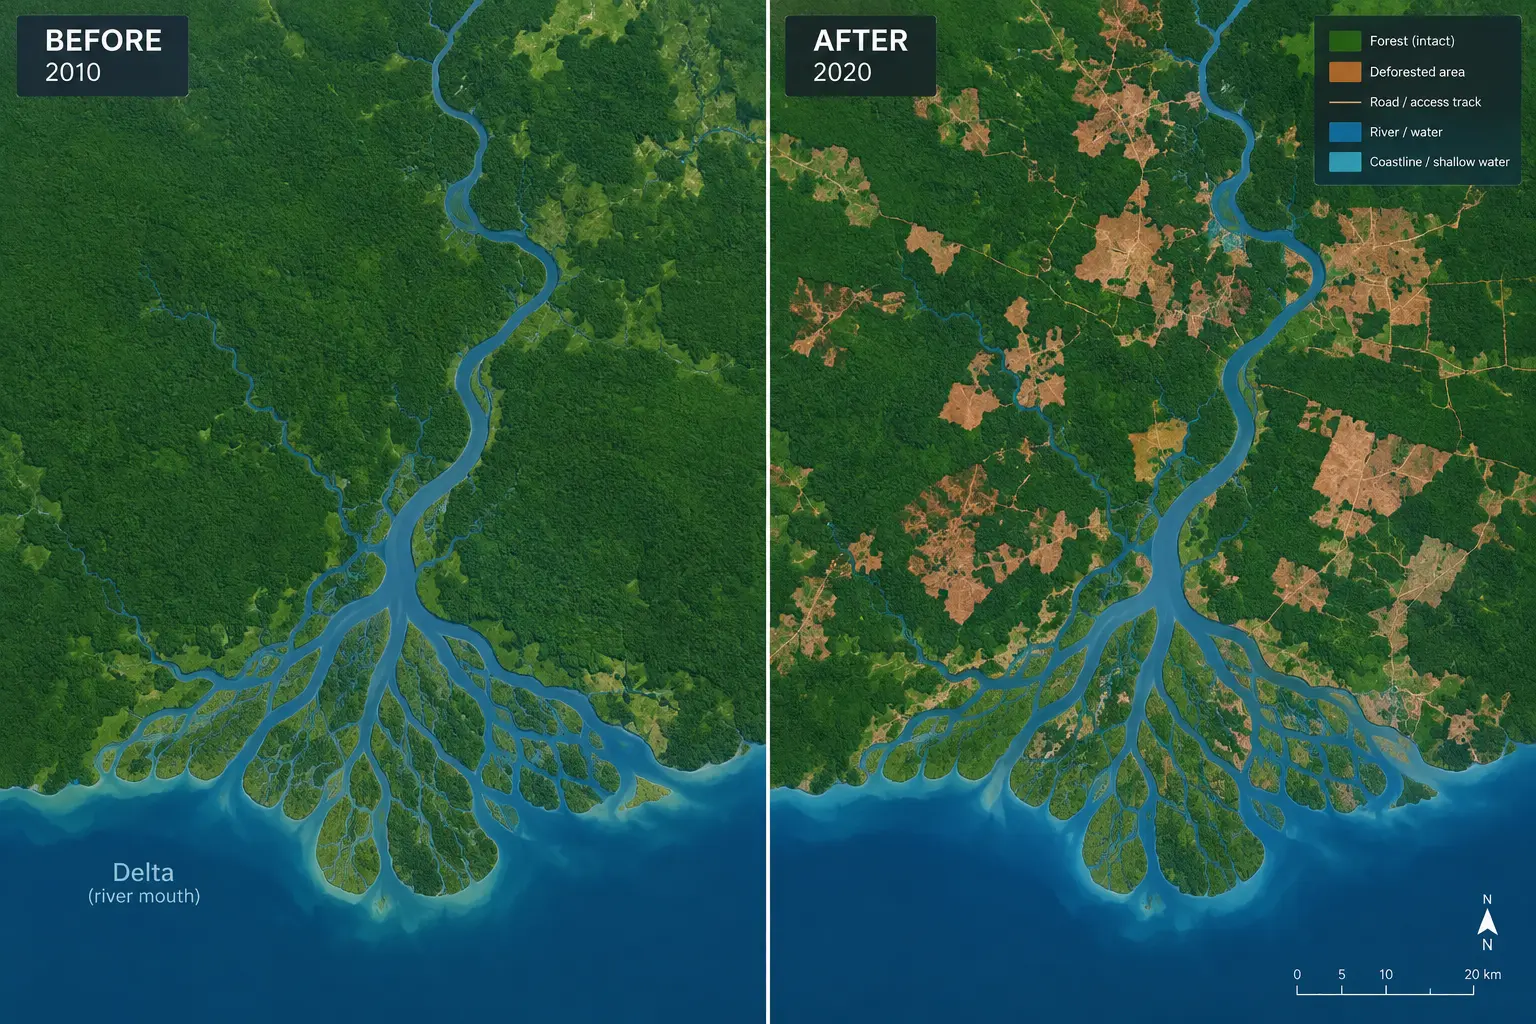
Google Earth Engine is free of charge for students, faculty and staff using it for academic research or teaching and learning, and for other noncommercial users, and gives access to a large archive of satellite imagery, including Landsat and Sentinel data commonly used for land-cover and vegetation-change studies. It runs the heavy processing on Google’s servers rather than your own laptop. This matters directly for Nigerian students: if your project tracks change over five or ten years, downloading and processing that much raw satellite data on a typical student laptop is often simply not feasible, while Earth Engine’s browser-based interface removes that barrier. The trade-off is a scripting interface (JavaScript in the browser Code Editor, with a Python option) that has its own learning curve, though many published Earth Engine examples for common tasks like vegetation-index calculation are available to adapt rather than write from scratch.
ArcGIS: The Commercial Standard, If You Can Access It
ArcGIS is Esri’s commercial GIS software and remains the tool many private-sector environmental consultancies use, so learning it has real career value — but it is a paid, licensed product, and the cost is a genuine barrier for a self-funded student project. Esri does sell an individual ArcGIS for Student Use licence at a reduced price, but its product page lists no figure, so check the current price and whether it is sold in Nigeria directly with Esri before you plan around it. If your department or university already holds an institutional ArcGIS licence with student access, it is worth using for the professional polish it adds; if not, QGIS produces an equivalent analytical result for an undergraduate project, and no panel should penalise you for using the free alternative. For the core analysis an undergraduate project needs — overlay, classification, area statistics and map layout — QGIS covers the same ground; the differences tend to show up in advanced 3D visualisation and enterprise features that a final year project rarely needs.
SPSS or Excel for the Survey Component
If your environmental science topic includes a perception or awareness survey (community attitudes to waste management, willingness to pay for a clean-up intervention, awareness of an environmental regulation), you need a statistics tool separate from your GIS software. Excel handles descriptive statistics (frequencies, percentages, simple charts) for a smaller dataset without difficulty; SPSS is the better choice once your analysis needs an inferential test (chi-square, correlation) tied to a stated hypothesis. A common combined design — a spatial map of, say, flood-prone zones paired with a household survey on flood-preparedness within those zones — needs both a GIS tool and a statistics tool in the same project, which is worth planning for from the proposal stage rather than realising midway that your single-tool plan cannot cover both halves of your research questions. See the dedicated SPSS-versus-Excel comparison linked below for the fuller breakdown of when each is the right choice.
How Should You Budget Time Across These Tools in Your Project Timeline?
Learning curve time is the most commonly underestimated part of an environmental science project timeline. A realistic budget allocates roughly two weeks to learn the GIS software itself (QGIS or Earth Engine, whichever your topic needs), a further one to two weeks for the actual data acquisition and cleaning (locating and downloading the right satellite scenes or shapefiles, checking their coordinate reference system matches), and only then does the analysis proper begin. Students who skip straight to analysis without this preparation phase are the ones most likely to discover a coordinate-system mismatch or a missing data layer during the week before submission — build the learning and data-acquisition time into your Chapter One work plan explicitly, not as an afterthought.
Do You Still Need Fieldwork if You Are Using Satellite Data?
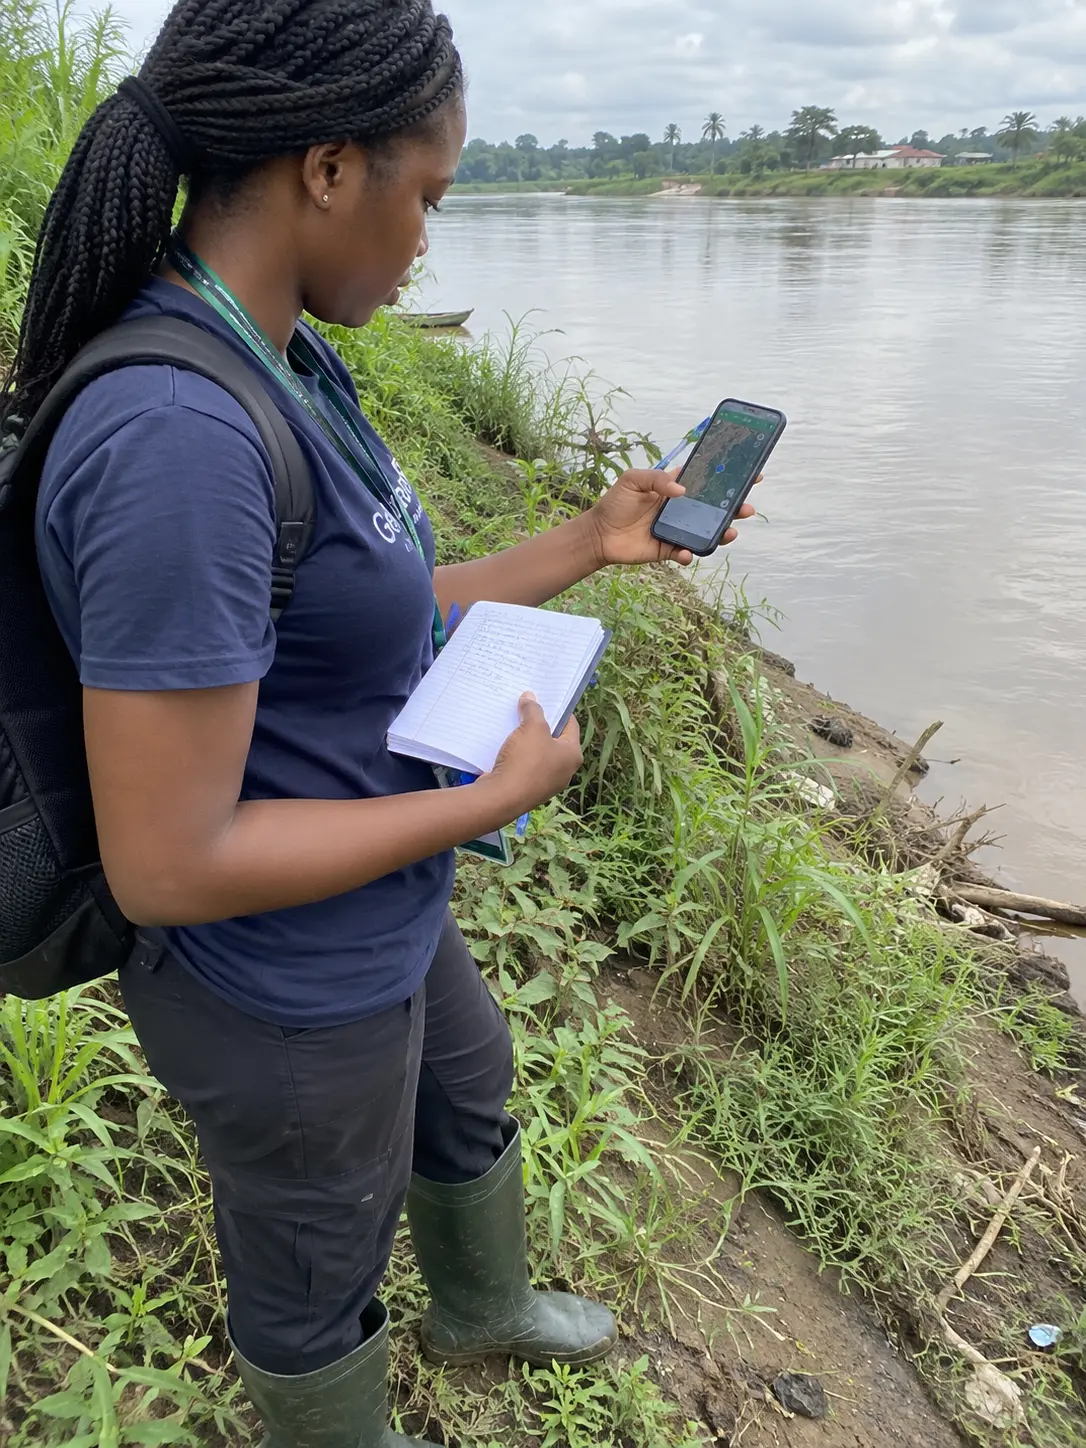
Yes — a classification produced entirely from satellite imagery without any ground-truthing is a common examiner objection. Even a small sample of field visits, recording GPS coordinates and a photograph at points you can later confirm against your classified map, meaningfully strengthens your accuracy claims and gives you a concrete paragraph to write in Chapter Three about how you validated your classification. A smartphone GPS app is usually sufficient for this — you do not need a survey-grade GPS unit for an undergraduate project unless your department specifically requires one for a particular topic (boundary surveying is the main exception).
Which Tool Fits Which Common Project Type?
| Project type | Recommended tool |
|---|---|
| Land-use/land-cover change mapping | QGIS + Google Earth Engine |
| Deforestation or vegetation-index monitoring over time | Google Earth Engine |
| Flood-risk or erosion mapping for one site | QGIS |
| Community environmental-awareness or perception survey | Excel or SPSS |
| Environmental Impact Assessment (EIA) report analysis | QGIS for spatial components, Excel/SPSS for any survey data |
Frequently Asked Questions
Do I need to buy any software for a GIS-based environmental science project?
No — QGIS and Google Earth Engine together cover the great majority of undergraduate environmental science GIS needs at zero cost. Only consider ArcGIS if your department already provides a licence.
Can I do my whole project without any GIS software at all?
Yes, if your topic is purely survey-based (awareness, perception, willingness-to-pay studies) with no spatial mapping component — in that case, Excel or SPSS alone is sufficient, and forcing a GIS component into a non-spatial topic will not strengthen your project.
Where can I get satellite imagery if I am not using Google Earth Engine?
The USGS EarthExplorer platform provides free direct downloads of Landsat imagery that you can then process in QGIS, which is a reasonable alternative if you prefer working entirely offline after the initial download.
Is QGIS accepted by Nigerian university panels, or do they expect ArcGIS specifically?
QGIS output is generally acceptable, since the final map and analysis are what get evaluated, not the specific software brand — but confirm with your supervisor if your department has a stated preference.
How long should I budget to learn QGIS before my data-analysis phase?
Plan for one to two weeks of tutorial-following before you start your actual project data, so you are not learning the software and analysing your data for the first time simultaneously under deadline pressure.
Do I need internet access throughout my QGIS analysis?
No — QGIS works fully offline once your data (shapefiles, downloaded satellite imagery) is on your computer; only Google Earth Engine requires a stable internet connection throughout, since its processing happens in the cloud.
What laptop specification do I actually need to run QGIS comfortably?
A mid-range laptop is usually enough for undergraduate-scale QGIS work, and 8GB of RAM is a comfortable starting point; very large, high-resolution satellite scenes can slow older or lower-spec machines, which is exactly the situation where doing the heavy processing in Google Earth Engine first and only bringing the final, smaller output into QGIS saves real time.
Can I combine outputs from Google Earth Engine and QGIS in the same project?
Yes, and this is the most common real workflow — export your processed result (a classified image or a computed index) from Earth Engine, then bring it into QGIS to add your final cartographic elements (legend, scale bar, north arrow, labels) before including it in your project document.
Choosing the right tool is only the start — writing up your methodology, presenting your maps correctly labelled, and discussing your results against the literature is where most of the writing time goes. More than 9,000 students have used Tesify to write over 15,000 chapters, and every one is 100% written by you: your maps, your analysis and your discussion stay your own work. Start your project with Tesify and turn your maps into a finished chapter.
If your project has a survey component, compare SPSS, Excel and JASP for the analysis, and see Google Forms versus KoboToolbox for collecting field survey data on a phone. Keep your sources organised with Mendeley versus Zotero before your reference list grows unmanageable. For data sources beyond satellite imagery, see where engineering project students in Nigeria find data, and for the generic mechanics of your methodology chapter, see how to write Chapter Three of a final year project.