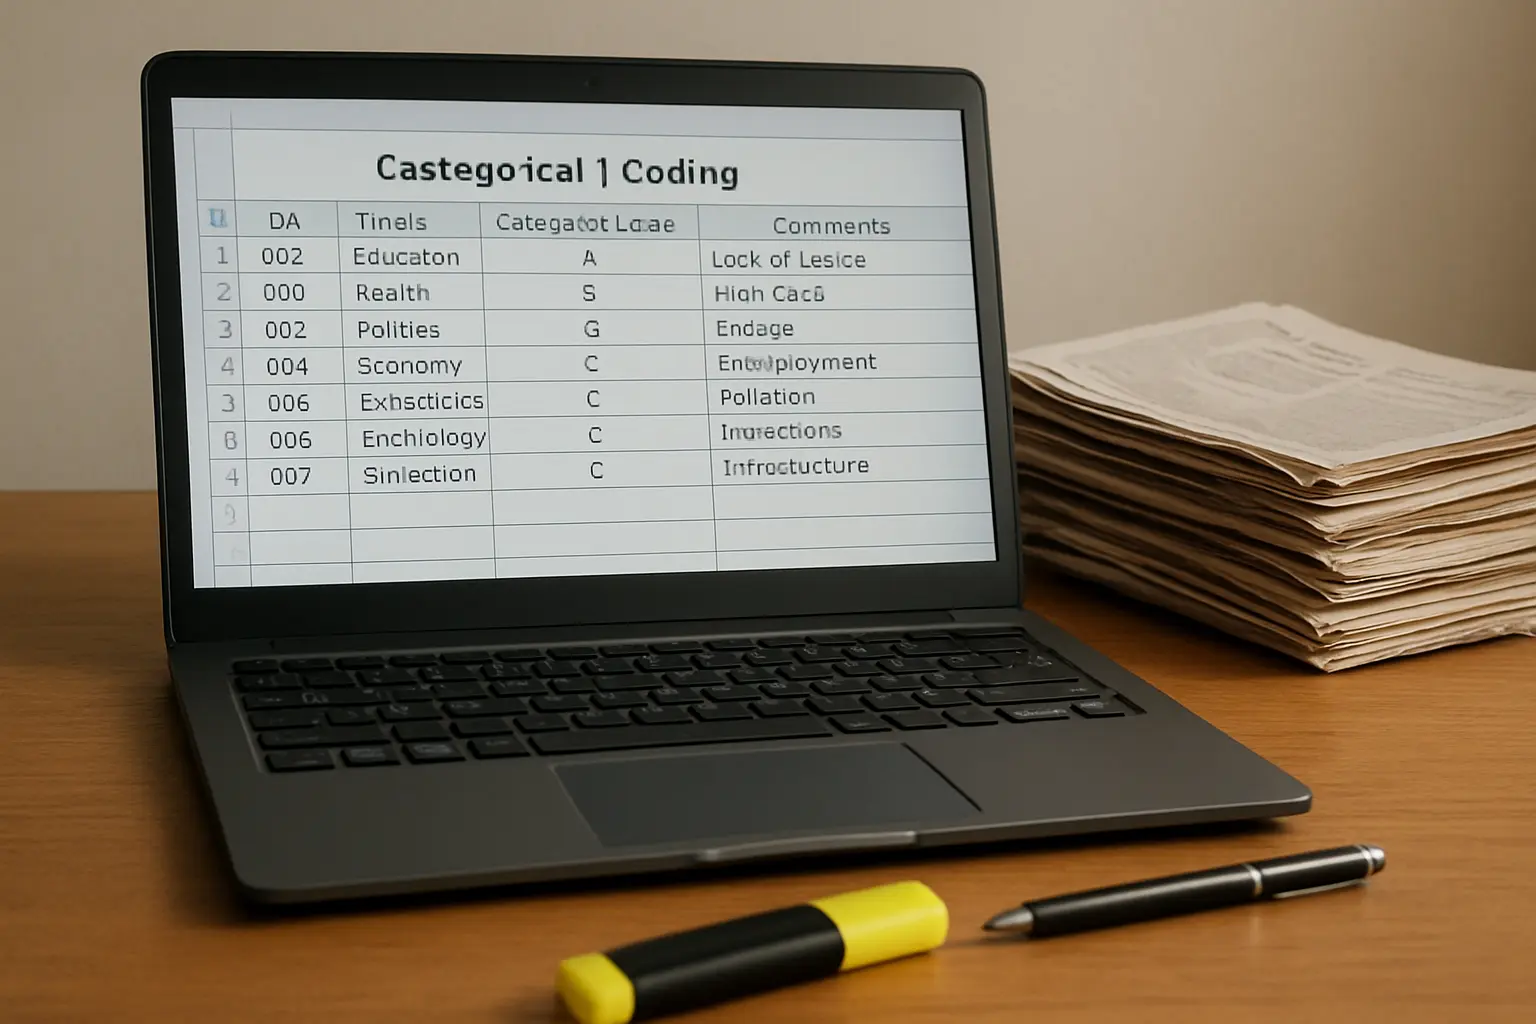
Coding two hundred newspaper articles, a month of radio bulletins, or a sample of social media posts for a mass communication content-analysis project needs a way to record consistent categorical judgements and prove two coders agree — a different job from transcribing an interview, and a different tool comparison from the one interview-based projects need. Here is what actually does that job, ranked by what most Nigerian departments already expect.
| Tool | What it’s for | Cost | Best for |
|---|---|---|---|
| Excel / Google Sheets coding sheet | Manual categorisation and frequency counts of coded media units | Free | Most Nigerian undergraduate content-analysis projects |
| ReCal (ReCal2 / ReCal3) | Free web-based intercoder reliability calculator | Free | Computing Krippendorff’s alpha or Scott’s pi once two coders have coded independently |
| NVivo | Qualitative and mixed-methods coding software with a built-in coding comparison query | Paid, often available through a university licence | Larger content-analysis projects with unstructured text alongside categorical coding |
| MAXQDA | Mixed-methods software with a dedicated intercoder agreement tool | Paid, often available through a university licence | Projects that need both quantitative coding and a qualitative reading of the same content |
| Dedoose | Cloud-based mixed-methods coding, accessible from any browser | Paid subscription, usage-based pricing | Group projects where multiple coders need simultaneous cloud access |
Which tool should most Nigerian mass communication students use?
For most undergraduate content-analysis projects — coding a sample of newspaper editions, radio bulletins, or social media posts against a fixed set of categories (frame, tone, source type, topic) — a well-built Excel or Google Sheets coding sheet is the strongest choice, and it is also what most Nigerian mass communication departments already expect, since it is the tool their own past students and staff know how to check. Pair it with ReCal, a free web-based calculator, to compute Krippendorff’s alpha or Scott’s pi once two independent coders have coded a subsample — this combination costs nothing and produces exactly the numbers Chapter Four needs. The budget runner-up for a project with unusually large or unstructured content — say, coding hundreds of long-form articles for both categorical variables and open thematic patterns — is NVivo where your department already holds an institutional licence, since paying for it yourself is rarely worth the cost for an undergraduate-scale sample.
How do NVivo, MAXQDA and Dedoose actually differ?
All three are mixed-methods packages that can hold a categorical coding scheme, but they differ in where the effort goes. NVivo has the largest user base among Nigerian postgraduate researchers and the most tutorial material available, which matters if you are learning it without formal training. MAXQDA’s intercoder agreement tool is more directly built for the kind of reliability testing a content-analysis project needs, producing a percentage-agreement and kappa figure in fewer steps than NVivo’s coding comparison query. Dedoose runs entirely in a browser and is well suited to a group project where coders are not all on campus at the same time, but its usage-based pricing model means costs scale with your project’s size in a way the other options do not. None of the three is necessary for a standard undergraduate categorical content analysis — they earn their cost when a project also needs a genuinely qualitative reading of the same material, and none of them replaces the codebook design work that has to happen before any tool is opened.
How is this different from choosing a tool for interview transcription?
A content-analysis project codes media artefacts you did not create — newspaper editions, broadcast transcripts, social media posts — against a fixed coding scheme, producing counts and proportions you test statistically; an interview-based qualitative project instead transcribes and thematically codes conversations you conducted yourself, usually without the same emphasis on numeric intercoder agreement. The tools overlap (NVivo and MAXQDA handle both), but the workflow does not: content analysis needs a coding sheet or codebook applied consistently by two or more coders and a reliability statistic reported in Chapter Four, while interview coding is usually a single researcher’s iterative thematic process closer to what a transcription and qualitative-coding tool comparison already covers. If your project needs interview transcription rather than media coding, that comparison — not this one — is the right starting point.
How does this connect to your methodology chapter’s coding scheme?
Your Chapter Three methodology defines the coding scheme, the population (editions, broadcasts, or posts), and the sampling method — commonly constructed-week sampling for print or broadcast content — before you touch any software. The tool comparison in this article is downstream of that design: whichever coding scheme Chapter Three specifies, the tool you choose here simply has to record it consistently and let you calculate reliability against it. Choosing a tool before finalising the coding scheme is a common ordering mistake — the categories should drive the spreadsheet columns, not the other way round.
How do you build a coding sheet before choosing software?
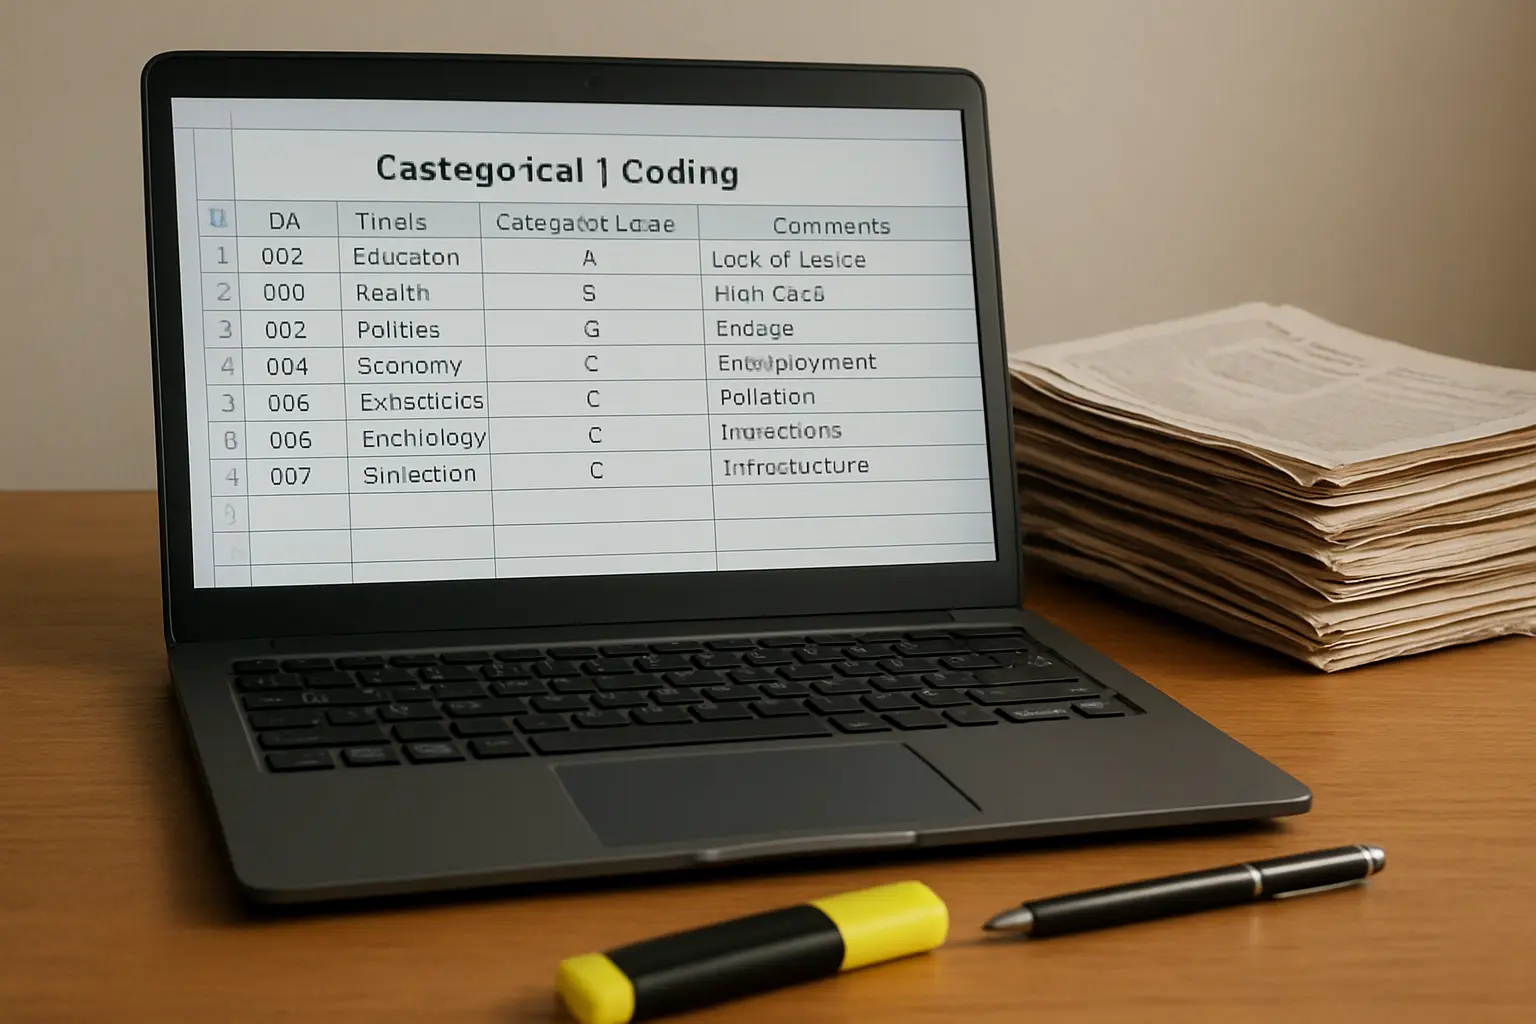
The software matters less than the coding scheme it holds. Before opening Excel or NVivo, finalise your codebook: each variable (frame, tone, source, topic category) defined with explicit, mutually exclusive categories and a short decision rule for ambiguous cases, tested on a small pilot sample of your content before full-scale coding begins. A coding sheet with columns for unit ID, date, outlet, and each coded variable, one row per coded unit, is the structure every tool in this comparison ultimately reproduces — Excel just makes you build it yourself, while NVivo and MAXQDA give you a coding interface around the same underlying structure.
How do you compute and report intercoder reliability?
Have a second coder independently code a subsample — 10 to 20 per cent of your total sample is typical in Nigerian mass communication projects — using the same codebook, without seeing the first coder’s decisions. Enter both coders’ results into ReCal (or NVivo/MAXQDA’s built-in tool) to compute Krippendorff’s alpha, Scott’s pi, or Holsti’s coefficient of reliability; Holsti’s formula is simpler to compute by hand and widely used in Nigerian departments, though it does not correct for chance agreement the way Krippendorff’s alpha does, so state clearly which coefficient you used and why. Report the actual figure in Chapter Three alongside your codebook description — “intercoder reliability was computed on a 15 per cent subsample using Holsti’s formula, yielding a coefficient of 0.86” is the sentence a panel expects, not a general claim that reliability was checked.

Worked example: setting up a coding sheet for a newspaper content analysis
Consider a project coding 200 news articles across two Nigerian newspapers over a constructed-week sample. In Google Sheets, the student builds one row per article with columns for article ID, newspaper, publication date, topic category (from a closed list of eight predefined categories), tone (positive/negative/neutral), and source type (government, expert, ordinary citizen, anonymous). A second coder independently codes a 15 per cent subsample using a printed copy of the same codebook. Both coders’ entries for that subsample are pasted into ReCal2, which returns Krippendorff’s alpha for each variable. Topic category returns an acceptable alpha; tone returns a lower figure, prompting the student to revisit and tighten the tone category’s decision rule before finalising the full coding pass. The finished sheet is then summarised with pivot tables — frequency of each topic category by newspaper, cross-tabulated tone by source type — which become Chapter Four’s tables directly, in the same pivot-and-chart format a statistical software comparison would produce for a survey-based project.
Frequently asked questions
Can I use Excel alone without a separate reliability calculator?
You can compute Holsti’s coefficient by hand or with a simple Excel formula, since its calculation is straightforward percentage agreement. Krippendorff’s alpha is more complex to compute manually, so a calculator such as ReCal is the practical choice for that coefficient.
How many coders does a Nigerian mass communication content-analysis project need?
Two is the practical minimum for reporting intercoder reliability. A single coder with no reliability check is acceptable in some departments for a very small-scale pilot but weakens the methodological rigor a panel expects for a full project.
Is NVivo worth learning if I only have one content-analysis project to complete?
Usually not, for a categorical coding project a spreadsheet handles well. NVivo becomes worth the learning curve when your project also needs qualitative thematic analysis of open-ended or unstructured text alongside the categorical coding.
What is a good intercoder reliability figure to report?
A Krippendorff’s alpha or Scott’s pi above 0.80 is generally considered strong; a figure between 0.67 and 0.80 is often treated as acceptable for exploratory research. For Holsti’s coefficient, which does not adjust for chance agreement, most Nigerian departments expect a higher raw figure, commonly above 0.85, to be treated as strong.
Does social media content need a different coding approach than newspapers or broadcasts?
The coding logic is the same, but social media content often needs an additional sampling decision (which platform, which hashtag or keyword, which time window) documented in Chapter Three, since social media content is far higher volume and less bounded than a newspaper’s daily edition count.
Can I code video or audio content directly, or do I need a transcript first?
Both approaches are used. Coding directly from video or audio saves transcription time and preserves tone-of-voice or visual cues a transcript loses, but requires the coder to review the same segment multiple times; a full transcript makes coding faster once ready but adds the transcription tool selection this comparison does not cover.
What happens if my two coders disagree on more than a few units?
Treat it as a codebook problem before a coder problem: review the disputed units together, tighten the decision rule for whichever category caused the disagreement, and re-code the affected subsample rather than simply averaging or picking one coder’s judgement as final.
Should the second coder be a coursemate, or does it need to be someone independent of the study?
A coursemate or classmate is standard practice in Nigerian undergraduate projects, provided they code independently from the same written codebook without discussing individual units with the primary researcher until the reliability check is complete.
Does a comparative content analysis across two or more outlets need a different tool from a single-outlet study?
No — the same coding sheet and reliability workflow apply. The only addition is an “outlet” column in your coding sheet so Chapter Four can cross-tabulate findings by outlet alongside the other coded variables.
Tesify’s Chapter Three and Four templates for content-analysis designs keep your codebook, your intercoder reliability figure, and your coded-data tables consistent with each other, so a panel can trace every Chapter Four percentage back to the coding scheme that produced it. Start on the free plan to build your coding sheet correctly from the start.