Tag: Chapter Four

  • Zones, Counts and Breakpoints: Writing Chapter Four of a Microbiology Project in Nigeria (2026)

    Zones, Counts and Breakpoints: Writing Chapter Four of a Microbiology Project in Nigeria (2026)

    Every Chapter Four guide you have opened assumes a questionnaire: a bio-data table, a four-point mean against 2.50, a chi-square. You have thirty plates, a grid of biochemical reactions and a page of zone diameters in millimetres. The chapter is not harder than the questionnaire version. It is four tables in a fixed order, and each one has a sentence pattern that turns a measurement into a finding.

    What Chapter Four is when your data came off a plate

    A microbiology project produces measurements, not opinions, and the chapter is organised by what was measured rather than by research question alone. Nigerian departments accept the same four-table spine for almost every undergraduate topic in the field, whether you sampled sachet water, ready-to-eat food from a campus canteen, hospital door handles, urine specimens or wound swabs. Table one gives the counts: how much grew, per millilitre or per gram, by sample or by location. Table two gives the identification: the colonial and microscopic appearance and the biochemical reactions that let you name each isolate. Table three gives frequency: how many of each organism, and what percentage of the total that is. Table four gives the antibiotic susceptibility: a zone diameter in millimetres for every isolate against every disc, and beside it the letter that interprets it. A plant extract project replaces table four with zones at graded concentrations plus a minimum inhibitory concentration, but the spine does not change. Write the tables in that order, number them Table 4.1 upward, and give each one a title that names the variable and the source, not the word Results.

    The counts table and the identification grid

    The counts table carries one number per sample with its unit written into the column heading, not into every cell: colony-forming units per millilitre for a liquid, per gram for a solid, per square centimetre for a swabbed surface. Report the dilution factor you multiplied by in the table note, because a panel member will ask, and give the mean of your replicate plates rather than one plate chosen because it counted nicely. If your topic implies a limit, compare against it explicitly and cite the document and its edition: the Standards Organisation of Nigeria publishes a drinking water standard your department will hold a copy of, and a food or water topic that never compares its counts to a stated limit has produced numbers instead of a finding.

    The identification grid is the table students most often build wrongly, because they present it as prose. It is a matrix: isolate codes down the left, and across the top the colonial morphology, Gram reaction, cell shape, then one column per biochemical test you actually ran, and a final column headed Probable organism. Catalase, coagulase, oxidase, indole, citrate, urease, motility, triple sugar iron and the sugar fermentations are the usual set. Fill the cells with plus and minus signs, not sentences, and state in the text below which key you read them against; Bergey’s Manual of Determinative Bacteriology is the reference Nigerian departments expect to see cited for conventional identification, and naming it is what converts a grid of symbols into an identification you can defend. Write probable organism, not confirmed organism, unless you ran a confirmatory method, and say so in Chapter Five as a limitation.

    The susceptibility table, and the standard you read it against

    A zone diameter on its own means nothing. Twenty millimetres is susceptible for one organism and drug pair and resistant for another, and the only thing that makes your table interpretable is a named breakpoint document with its edition. Two exist, and a Nigerian student can use either, but must use one of them consistently and say which in Chapter Three.

    Document What it is Current edition Cost Method it assumes
    CLSI M100 Performance Standards for Antimicrobial Susceptibility Testing, published by the Clinical and Laboratory Standards Institute 36th edition, published 26 January 2026 Purchased from CLSI Valid only if the procedures in CLSI M02 for disk diffusion, M07 for dilution in aerobes and M11 for anaerobes were followed
    EUCAST breakpoint tables Clinical breakpoint tables of the European Committee on Antimicrobial Susceptibility Testing v16.1, valid 24 June 2026 to 31 December 2026 Free to download EUCAST disk diffusion and MIC methodology, with its own dosages document at v16.0 effective 1 January 2026

    CLSI M02, the disk diffusion standard the M100 tables depend on, is in its fourteenth edition, published 19 March 2024. If your laboratory ran Kirby-Bauer on Mueller-Hinton agar and read the zones with a ruler or callipers, you followed a CLSI-shaped method and M100 is the natural table to interpret against; if your department has no current copy, the free EUCAST tables are the honest alternative, and using them is not a weakness provided Chapter Three says the EUCAST methodology was followed rather than silently mixing the two. The commonest single error in a Nigerian microbiology Chapter Four is a susceptibility table interpreted against a breakpoint document that is never named, or named without an edition or version. Write it in full once, in Chapter Three, and refer to it by name under every susceptibility table thereafter.

    The second commonest error is the letter I. Under EUCAST, since 2019, I no longer means intermediate: the committee redefined it so that a microorganism is categorised as susceptible, increased exposure when there is a high likelihood of therapeutic success because exposure to the agent is increased by adjusting the dosing regimen or by its concentration at the site of infection. If you are using EUCAST tables, write the category out in words the first time and do not gloss it as intermediate anywhere in the chapter. A panel member from a clinical microbiology background will notice, and it is the cheapest correction you will ever make.
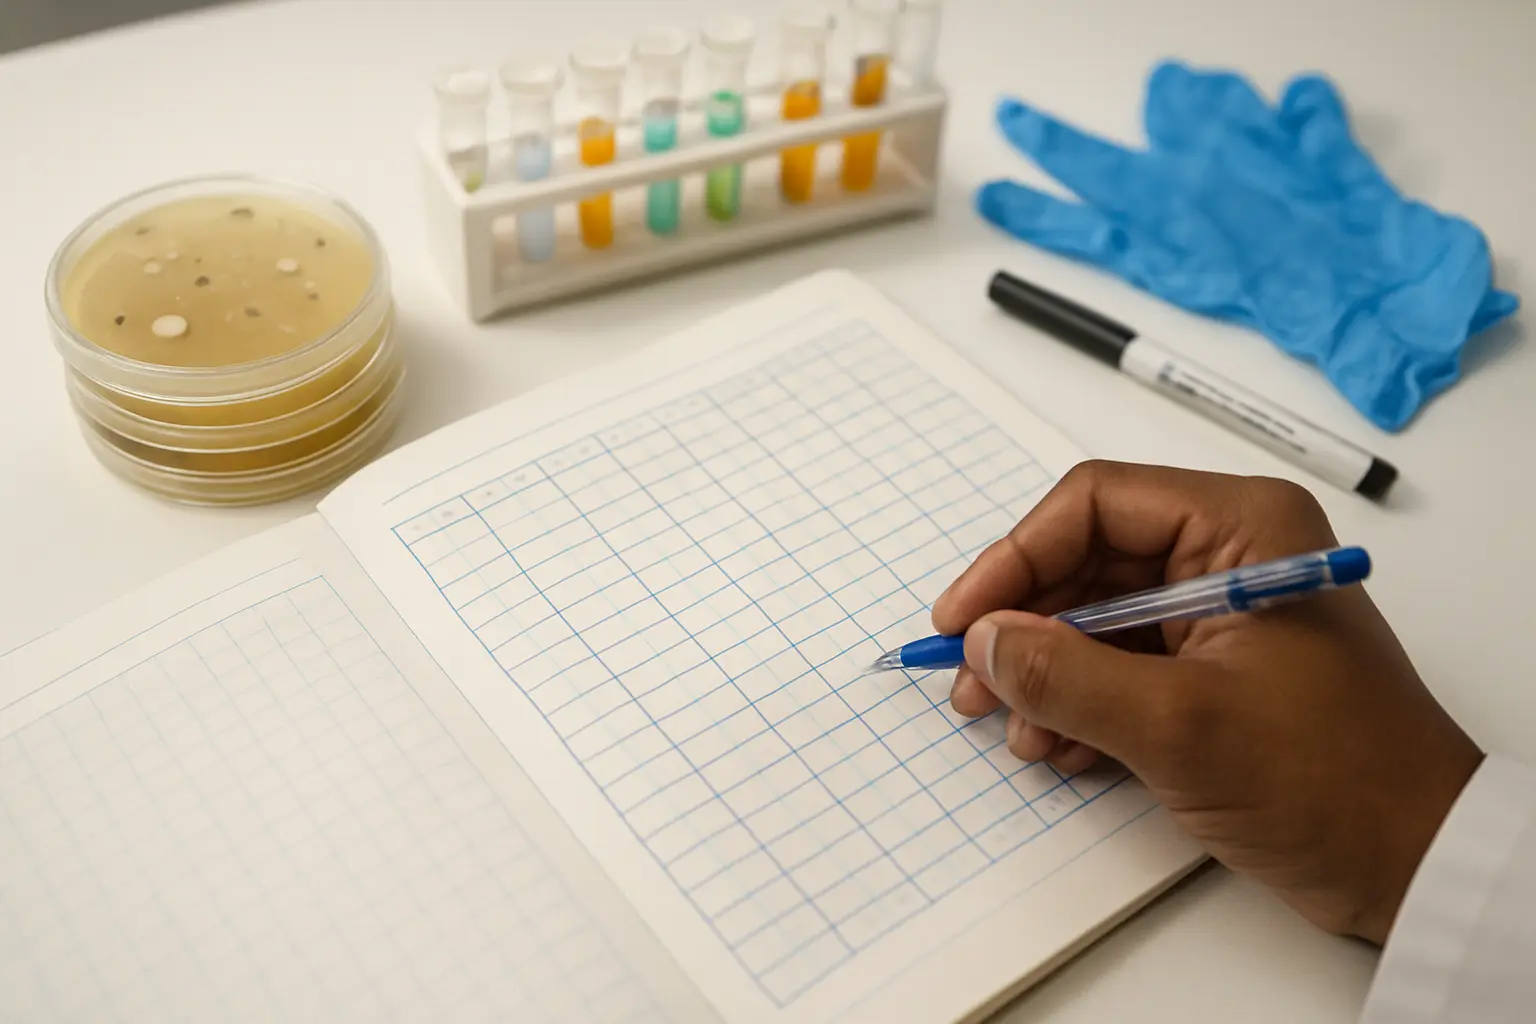
    A Nigerian student recording colony counts and biochemical test results in a ruled laboratory notebook beside culture plates
    Isolate codes down the left, one column per test across the top: the identification grid is built at the bench, not written up from memory afterwards.

    The MAR index: one calculation that upgrades the whole chapter

    If you tested each isolate against a panel of antibiotics, you already hold the data for the multiple antibiotic resistance index, and computing it costs one column. For each isolate, divide the number of antibiotics to which it was resistant by the total number tested. An isolate resistant to six of ten discs has an index of 0.6. The convention comes from Krumperman’s 1983 paper in Applied and Environmental Microbiology, which proposed indexing to identify high-risk sources of faecal contamination and set the threshold above which a source is treated as high risk at 0.2. The reference in APA form is Krumperman, P. H. (1983). Multiple antibiotic resistance indexing of Escherichia coli to identify high-risk sources of fecal contamination of food. Applied and Environmental Microbiology, 46(1), 165 to 170.

    The index earns its place because it converts a wall of letters into one number per isolate that a reader can compare, and because the threshold gives you a claim: isolates above 0.2 came from environments where antibiotics are heavily used, which for a sachet water or street food topic is the whole argument of your Chapter Five. Add the column to your susceptibility table, add a sentence stating how many isolates exceeded the threshold and what proportion of the total that is, and the discussion writes itself. For a project on the antibacterial activity of a plant extract the equivalent upgrade is the pair of endpoints: the minimum inhibitory concentration, the lowest concentration of extract at which no visible growth appeared in the tube or well, and the minimum bactericidal concentration, established by subculturing the clear tubes onto fresh agar and reporting the lowest concentration that produced no growth on the plate. Report both in the same unit, usually milligrams per millilitre, and state the solvent and the negative control, because an extract dissolved in dimethyl sulfoxide needs a solvent-only control before any zone you measured belongs to the plant.

    Writing the discussion: three moves under every table

    Nigerian departments differ on whether the discussion sits inside Chapter Four or opens Chapter Five, so follow your own department’s format, but the moves are the same wherever it lives. Move one restates the result in words with the number in it, without repeating the whole table: the highest mean count was recorded in samples from the motor park, at a figure you quote once. Move two compares it with published work, and this is where a microbiology discussion is won or lost, because the comparison must be with studies on the same organism from a comparable setting, and Nigerian journals are where those live. The African Journal of Clinical and Experimental Microbiology and the microbiology titles hosted on African Journals Online carry the isolation-and-susceptibility studies from Nigerian states that your examiner has read; a discussion that compares a Kano sachet water result only with European clinical isolates reads as though the literature search stopped at the first search engine page. Move three explains the difference, in one sentence, with a mechanism rather than a shrug: a higher resistance rate than an earlier study in the same state is attributable to something nameable, and if you cannot name it, say the design cannot separate the possibilities and put that in the limitations. The same discipline in stating findings applies here as anywhere, and the ladder of how strongly you can state a finding is worth reading before you write the word proves.

    Two structural points that panels raise every session. First, every table needs the interpretation paragraph beneath it, and the general architecture of that paragraph is set out in the guide to writing Chapter Four table by table; the microbiology version simply substitutes a count or a zone for a mean. Second, if you ran any inferential test, name it and its assumption: comparing mean counts across three sampling sites is an analysis of variance, and comparing resistance frequency between two sources is a chi-square on counts, never on percentages. The decision table in the guide to choosing a statistical test covers both. Many microbiology projects report only descriptive statistics, which is acceptable when the objectives were framed descriptively, but a project whose objectives promise a comparison and then delivers only percentages will be asked why at the defence, and the inventory of questions panels actually ask lists that one under methodology.

    Carrying it into Chapter Five

    The summary in Chapter Five is built from your table titles, one sentence each, in the order the tables appeared. The conclusion answers each objective in turn: whether the samples were contaminated, which organisms predominated, and what the susceptibility profile means for treatment or for the safety of the product. Recommendations must be addressed to named bodies, which in a microbiology project are usually regulators, hospital infection control committees, vendors or the state ministry of health, not the vague public. The contribution to knowledge is the one your panel examines hardest, and for an isolation-and-susceptibility project it is almost always local and current: a susceptibility profile for a named organism from a named source in a named location at a stated date, which did not exist before you produced it. The structure of the whole chapter is set out in the guide to writing Chapter Five section by section, and the sister case of an engineering project with laboratory rather than survey data is worked through in what goes in Chapter Four when there is no questionnaire.

    Where Tesify fits when the plates are read and the chapter is blank

    The laboratory work is finished and the writing is what is left, which is the part that takes weeks you no longer have. Paste your counts, your identification grid and your zone diameters into Tesify and it drafts the presentation paragraph under each table in the pattern above, the interpretation sentence that names the breakpoint document and the category, and the three-move discussion for each finding with the comparison left open for the Nigerian study you choose to cite. The automatic bibliography formats Krumperman, the standards and the journal articles in your department’s style so the reference list stops being an evening’s work, and the AI editor tightens the prose without touching a figure. The free plan is the entry point and asks for no card. Everything it produces is drafted from the numbers you measured, which is the only version you can stand behind when a panel member points at Table 4.4 and asks how you arrived at that letter.

    Turn your plates and zones into Chapter Four this week

    Start on the free plan, paste your counts, identification grid and susceptibility readings, and get the tables, the interpretation paragraphs and the discussion moves drafted in the order your department expects.

    Draft your microbiology Chapter Four in Tesify

    Frequently asked questions

    What goes in Chapter Four of a microbiology project?

    Four tables in order: colony counts with their units, the isolate identification grid of morphology and biochemical reactions, the frequency and percentage of each organism, and the antibiotic susceptibility table of zone diameters with their interpreted categories. Each table carries an interpretation paragraph beneath it.

    Which breakpoints should I use, CLSI or EUCAST?

    Either, provided you use one consistently and name it with its edition in Chapter Three. CLSI M100 is in its 36th edition, published 26 January 2026, and is purchased; the EUCAST clinical breakpoint tables at v16.1 are free to download and valid to 31 December 2026.

    Does I mean intermediate in a susceptibility table?

    Not under EUCAST. Since 2019 the category means susceptible, increased exposure, defined as a high likelihood of therapeutic success because exposure to the agent is increased by adjusting the dosing regimen or by its concentration at the site of infection. Write it out in words rather than glossing it as intermediate.

    How do I calculate the multiple antibiotic resistance index?

    Divide the number of antibiotics to which an isolate was resistant by the total number tested. An isolate resistant to six of ten discs scores 0.6. Following Krumperman’s 1983 paper, an index above 0.2 marks the sample as coming from a high-risk source.

    Do I need statistical tests in a microbiology project?

    Only if your objectives promise a comparison. Descriptive percentages are acceptable for a purely descriptive objective, but an objective that compares sites or sources needs an analysis of variance on means or a chi-square on counts, never on percentages.

    Can I say I identified an organism if I only ran biochemical tests?

    Write probable organism and name the key you read the reactions against, usually Bergey’s Manual of Determinative Bacteriology. Conventional identification without a confirmatory method belongs in Chapter Five as a stated limitation, which panels accept when it is declared.

    What do I report for a plant extract project?

    Zones of inhibition at each concentration, the minimum inhibitory concentration as the lowest concentration with no visible growth, and the minimum bactericidal concentration from subculturing the clear tubes. State the solvent and include a solvent-only negative control.

    Where do I find Nigerian studies to compare my results with?

    The African Journal of Clinical and Experimental Microbiology and the microbiology titles hosted on African Journals Online carry isolation and susceptibility studies from Nigerian states, which are the comparable settings your examiner expects to see in the discussion.

    How much does Tesify cost?

    The free plan is the entry point and needs no card. Paid plan prices are shown on the Tesify site, where local payment options are listed.


  • Your Civil Engineering Project Has No Questionnaire. So What Goes in Chapter Four? (2026)

    Your Civil Engineering Project Has No Questionnaire. So What Goes in Chapter Four? (2026)

    You have spent six weeks in the materials laboratory. There are cube crushing results at 7, 14, 21 and 28 days sitting in a notebook, a sieve analysis you ran three times, and a slump reading for every mix. Now you open Chapter Four to start writing, search for guidance, and every template you find opens with a bio-data table of respondents, a four-point Likert scale and a 2.50 decision criterion.

    None of it applies to you. You did not administer a single questionnaire and you are not going to.

    This is one of the loneliest points in a Nigerian engineering project, and it is entirely solvable. Chapter Four does the same job in every discipline — it presents what you found and interprets it — but in civil engineering the data are measurements, the comparison is against a standard rather than a mean criterion, and the tables look completely different.

    What Chapter Four is actually for

    Strip away the survey conventions and Chapter Four answers three questions in order:

    1. What did the tests produce? — presentation
    2. What do those numbers mean against a reference? — analysis
    3. Why did they come out that way? — interpretation

    Your chapter follows your objectives from Chapter One, in the same order, exactly as a survey-based project does. If objective one was to determine the physical properties of the material and objective two was to determine the compressive strength at varying replacement levels, then section 4.1 presents the physical properties and section 4.2 presents the strength results. That sequencing rule is the one thing engineering projects share with the standard structure described in the pillar on data presentation, analysis and interpretation — read it for the interpretation style, and ignore its Likert tables.

    The four table types that carry an engineering Chapter Four

    1. The material characterisation table

    This comes first, before any performance result, because it establishes that your inputs were what you claimed. For a concrete study it holds specific gravity, bulk density, moisture content, fineness modulus and the aggregate grading. For a soil study it holds natural moisture content, specific gravity, Atterberg limits — liquid limit, plastic limit, plasticity index — and the grading from the sieve analysis, followed by the AASHTO or USCS classification that those values produce.

    Each row should carry three columns: the property, your measured value, and the standard requirement or typical range. That third column is what turns a data dump into analysis, and students consistently leave it out.

    2. The results-by-variable table

    This is the heart of the chapter. Rows are your treatment levels — replacement percentages, curing ages, mix ratios, compaction efforts — and columns are the measured outputs.

    For a partial replacement study, a table of average compressive strength in N/mm² with replacement level down the side and curing age across the top presents the entire experiment on a single page. Report the mean of your three cubes per age per mix, and state in the table caption that each value is the average of three specimens. Panels ask whether you tested one cube or three, and a caption answers it before the question arrives.

    3. The comparison-against-standard table

    Every measured value in a civil engineering project means something only relative to a specification. Your comparison column names the reference explicitly — the relevant British Standard for the test method, the Nigerian Industrial Standard for the material, or the Federal Ministry of Works General Specification for Roads and Bridges for pavement layer requirements.

    So a CBR value of 12 per cent is not a finding on its own. “A soaked CBR of 12 per cent, which falls below the minimum specified for subbase material in the Nigerian General Specification, indicating that the soil requires stabilisation before use in that layer” is a finding, because it carries a decision.

    4. The trend chart

    One chart per relationship, no more. Strength against curing age with a line for each replacement level. Dry density against moisture content for a compaction curve, with the maximum dry density and optimum moisture content marked. Load against deflection for a structural test.

    Axes labelled with units, a caption below in your department’s figure-numbering format, and referenced in the text as “Figure 4.3 shows…” before it appears. Charts that are never mentioned in the prose read as decoration.

    Do you need statistics at all?

    Often less than you fear, and occasionally more.

    If your project measured properties without comparing treatments — characterising a soil, testing sandcrete blocks from three markets — descriptive presentation against standards is sufficient. Means and, ideally, standard deviations across your replicates are all a panel expects.

    If your project varied a treatment across levels, an analysis of variance strengthens the chapter considerably. Testing five replacement percentages at 28 days, ANOVA tells you whether the differences between mixes are statistically significant rather than experimental scatter, and a post-hoc test tells you which specific pairs differ. Regression is appropriate where you are modelling one continuous variable against another, such as strength against curing age.

    None of this requires expensive software. The tools that handle ANOVA and regression on a project-sized dataset are compared in the piece on SPSS, Excel, JASP and jamovi for a final year project, and two of the four are free.

    The interpretation paragraph, in three moves

    Presenting a table is not analysis. After every table, write a paragraph that makes three moves:

    Move one — state what the table shows, in numbers. “Table 4.2 shows that compressive strength at 28 days decreased from 24.6 N/mm² at 0 per cent replacement to 18.3 N/mm² at 20 per cent replacement.”

    Move two — compare it to the reference or the trend. “The 10 per cent replacement mix attained 22.1 N/mm², which exceeds the 20 N/mm² target strength for the design grade, while replacement levels above 15 per cent fell below it.”

    Move three — explain why, with a citation. “The reduction at higher replacement levels is attributable to the lower calcium content of the pozzolanic material and its slower rate of strength development, consistent with the findings of [author] ([year]), who reported a similar decline beyond 15 per cent replacement.”

    Three moves, three or four sentences, after every single table. Do that consistently and Chapter Four writes itself at roughly a page per table.

    What belongs in Chapter Five instead

    Recommendations do not go in Chapter Four. “Ten per cent replacement is recommended for non-structural applications” is a Chapter Five sentence. Chapter Four reports that the 10 per cent mix met the target strength; Chapter Five decides what should be done about it, alongside the summary, conclusion and contribution to knowledge set out in the guide to writing Chapter Five of a Nigerian final year project.

    Keeping that boundary clean is one of the easiest marks in an engineering project, and mixing the two is one of the most common corrections.

    The questions the panel will ask about your results

    Four, reliably:

    • “How many specimens per data point?” Three is the expectation for cube tests. If you tested one, say so and record it as a limitation rather than letting the panel discover it.
    • “Which standard did you test to?” Name the test standard, not just the test. “Compressive strength was determined in accordance with BS 1881” is the answer.
    • “Why did the strength drop at that level?” A mechanism, not a restatement. Chemistry, particle packing, water demand — something physical.
    • “What would you have done differently?” Have one honest answer ready: more curing ages, a wider replacement range, duplicate soaked CBR samples.

    The wider inventory of what Nigerian panels ask, across all six areas they probe, is in the guide to project defence questions in Nigeria. Computer science students face the same structural problem with a build project instead of a laboratory one, and the parallel is worth reading in the comparison of system development methodologies for a computer science project.

    You have the results. The writing is the bottleneck.

    This is the part nobody warns engineering students about. The laboratory work is finished, the numbers are correct, you know exactly what they mean — and there are still forty pages of formal departmental prose standing between you and submission, with a defence date that is not moving.

    Writing up is not the same skill as running a CBR test, and it should not be what costs you a class of degree.

    Tesify drafts your chapters from your own topic, objectives and results. It writes around the tables you already produced, keeps your terminology and reference list consistent across every chapter, and lets you rework a section after your supervisor’s corrections without rebuilding the chapter from the beginning. Your data stay yours, your findings stay yours, and the interpretation stays yours — what disappears is the blank page.

    The free plan is the place to start. You can draft a chapter, see whether the output sounds like your department’s house style, and decide from there without paying anything.

    Start your project on Tesify for free and get Chapter Four written around your test results this week.

    Frequently asked questions

    What goes in Chapter Four of a civil engineering project?

    Presentation of laboratory or field results, analysis of those results against the relevant standards, and interpretation of why the values came out as they did. It is organised in the order of your objectives, and it typically contains material characterisation tables, results tables by treatment level, comparison against specification, and trend charts — with an interpretation paragraph after each one.

    Does an engineering project need hypotheses and statistical tests?

    Not always. Characterisation studies present descriptive results against standards. Studies comparing treatment levels benefit from analysis of variance to show whether differences are significant, and regression where you are modelling one continuous variable against another. Check your department’s guidelines, since some require formal hypotheses even for laboratory work.

    How many cubes should I crush per test age?

    Three specimens per mix per curing age is the standard expectation, with the reported strength being their average. State in the table caption that each value is a mean of three specimens. If constraints forced you to fewer, report the actual number and record it as a limitation in Chapter Five rather than leaving the panel to find it.

    Is using an AI writing tool for my project cheating?

    It depends entirely on what you use it for. Using a tool to draft and structure prose around results you generated yourself is writing assistance, in the same family as a reference manager or a grammar checker. Submitting work whose findings, data or analysis you did not produce is academic dishonesty. Your own institution’s policy governs, so read it, and disclose your use of AI tools if your department requires disclosure.

    Will using Tesify raise my similarity score?

    Drafts are generated for your specific topic, objectives and results rather than assembled from existing project documents, and the citations are attributed. The reliable practice regardless of tool is to run a similarity check yourself before submission, review anything flagged, and quote or paraphrase properly with attribution. No tool should ever be presented as a way to defeat a university’s plagiarism check.

    How much does Tesify cost, and is there a free option?

    There is a free plan, and it is the sensible way to start — draft a chapter, judge the output against your department’s house style, and only then decide whether a paid plan is worth it to you. Current plan details and naira pricing are shown when you create a project.

    Can it write my chapter if my data are tables of test results rather than survey responses?

    Yes. You supply the results and the standards you are comparing against, and the draft is built around them — presentation, comparison and interpretation in the sequence your objectives set. Laboratory and design-based projects are exactly the case where a generic survey template fails and drafting against your own material matters most.

    What if my supervisor sends the chapter back with corrections?

    That is expected, and it is the case the tool is built for. You revise the specific section against the comment rather than rewriting the chapter, and the surrounding text, terminology and references stay consistent. Most of the time lost in a Nigerian project goes to correction cycles, not to first drafts.

  • Your Data Is Collected and Chapter Four Is Blank (2026)

    Your Data Is Collected and Chapter Four Is Blank (2026)

    The questionnaires came back three weeks ago. They are in a bag under your bed, or encoded into a spreadsheet you have not opened since. Chapters One, Two and Three are done and approved. Chapter Four is a heading and a blinking cursor, and the defence date has not moved.

    This is the most common place a Nigerian final year project stalls, and it is worth understanding why, because the reason is not laziness and it is not that you do not know statistics.

    Why Chapter Four freezes people when Chapters One to Three did not

    Chapters One, Two and Three are chapters about intentions. You state a problem you intend to solve, review literature you intend to build on, and describe a method you intend to follow. All of it can be written from decisions you already made, and none of it can be checked against anything external. If a sentence is weak, it is weak in a way that reads as style.

    Chapter Four is the first chapter where you can be wrong in a way that anybody can check. A percentage that does not sum. A mean that contradicts the table above it. A chi-square value nobody can reproduce. A respondent count that reads 231 here and 236 there. All of it is arithmetic, and arithmetic is either right or it is not.

    That is what the blank page is about. It is not writer’s block. It is the reasonable fear of committing a checkable claim to paper — and the fear grows every day you avoid it, because the deadline shrinks while the task stays the same size.

    The unlock: you are not writing a chapter

    You are writing one table, four times.

    A Nigerian Chapter Four is not a piece of continuous prose. It is a repeating unit: a research question, the table that answers it, and a paragraph underneath. Then the same unit again. Then again. Then the hypotheses, which are their own short unit.

    That matters because a repeating unit is enormously easier to start than a chapter. You do not need to know how Chapter Four ends before you write its first paragraph. You need to know what your first research question is and which table answers it — and you decided both of those in Chapter One.

    Write the research questions on four sticky notes, in order, and put the name of the answering table under each. That is your chapter outline, and it took four minutes.

    Sticky notes laid out in a row, each carrying one research question and the table that answers it
    Four minutes with sticky notes turns “write Chapter Four” into four separate small jobs, each of which you know how to do.

    The four-evening plan

    1. Evening one: encode and screen. Number the questionnaires, build the variable list, enter the data, then run frequencies and check every minimum and maximum. Write nothing. The full order of operations is in the guide to analysing project data in SPSS step by step.
    2. Evening two: produce the tables. The bio-data table, then one mean table per research question, then the test for each hypothesis. Which test belongs to which question is settled in choosing the statistical test for your project. Still write no prose.
    3. Evening three: the paragraphs. One under each table, three sentences minimum. This is the slowest evening and it deserves your best hours.
    4. Evening four: reconcile. One respondent count everywhere including the abstract, every table numbered and referred to in the text, every hypothesis carrying a stated decision.

    Four evenings is a realistic figure for a straightforward undergraduate project, and it is achievable precisely because the first two evenings involve no writing at all. Most of the paralysis comes from trying to do all four at once.

    The three sentences that unblock any table

    When you reach evening three and the paragraph will not come, the problem is almost always that you are trying to write something interesting. Do not. Write these three sentences, in this order:

    1. What the table shows. “Table 2 shows a grand mean of 2.85 against a criterion mean of 2.50, indicating general agreement.”
    2. What that means here. “This suggests the constraint is felt most acutely in the evenings, consistent with the reliance on alternative power sources reported in item 2.”
    3. How it compares. “Adeyemi (2023) reported a similar pattern among undergraduates in a comparable state university.”

    That is a complete, defensible interpretation paragraph. It is not elegant and it does not need to be. Do it four times and Chapter Four exists. The full pattern, with worked Nigerian tables, is in the guide to writing Chapter Four.

    Sentence three is the one students skip, and skipping it is why supervisors write “no discussion” in the margin — the same correction loop described in breaking the Chapter Two correction loop, arriving two chapters later.

    A Nigerian student typing a results chapter on a laptop at night beside printed tables
    Tables first, prose second. Nobody writes a good interpretation of a table they have not built.

    What an AI project writer can and cannot do here

    Worth being precise about, because the honest boundary is narrower than the advertising and the temptation peaks at exactly the point in the calendar you are probably at now.

    It cannot produce your numbers. Your means, your percentages and your chi-square value come from your data file and nowhere else. Anything that hands you statistics you did not compute is handing you a problem you will meet again at the defence, when a panel member asks which software produced them and on how many respondents. There is no recovery from not knowing where your own numbers came from.

    It cannot write sentence two. Why your lowest-rated item is lowest depends on your department, your campus, your local government area and your respondents. That is the sentence a panel probes hardest, and it is the one only you can write.

    It cannot pick your comparison study. Sentence three has to name a study that is actually in your Chapter Two and that you have actually read. A citation that does not resolve is worse than no citation, and it puts every other reference in your chapter in doubt.

    What it is genuinely good at is structure and consistency — holding the chapter in the shape your department expects, keeping each citation attached to the source you actually opened, and making sure the respondent count and the tool names stay identical everywhere they appear. That is the mechanical work that is easy to get wrong at midnight and tedious to check by hand, and it is most of what stands between a finished analysis and a submitted chapter.

    And the thing not to do

    Do not buy a written Chapter Four. Beyond the integrity problem, it fails on its own terms: a purchased chapter analyses data that is not yours, so its numbers will not match your Chapter Three, its respondent count will not match your instrument, and you will not be able to answer a single question about it. What you are actually buying is examined in project topics and materials in Nigeria: what you are actually buying.

    You have the data. That is the part that could not be rushed, and it is done. What remains is four evenings of ordinary, structured work.

    The data is yours. Get the chapter out of your head and onto the page.

    Tesify holds your chapters in the structure your department expects and keeps every citation attached to a source you actually opened, so your respondent count stays consistent across Chapters Three, Four and the abstract while you write. Over 9,000 students have used it to write more than 15,000 chapters, and every word is still written by you.

    Start your Chapter Four in Tesify

    Frequently asked questions

    How do I start writing Chapter Four when I do not know where to begin?

    Write your research questions on separate notes in order and name the table that answers each. That is your outline. Then build all the tables before writing any prose, and write one three-sentence paragraph under each.

    How long should Chapter Four take?

    About four evenings for a straightforward undergraduate project: one to encode and screen, one to produce the tables, one for the interpretation paragraphs and one to reconcile. It takes far longer if you try to do all four at once.

    Why can I write Chapters One to Three but not Chapter Four?

    Because the first three are about intentions and cannot be checked against anything external, while Chapter Four commits arithmetic that anybody can verify. The hesitation is rational; the fix is to break it into one table at a time.

    Can an AI write my Chapter Four for me?

    It should not, and the parts that matter it cannot. Your numbers come from your data file, the interpretation depends on your setting, and the comparison must name a study from your own Chapter Two. Use a tool for structure and consistency and write the substance yourself.

    What if my analysis shows nothing significant?

    Report it. A non-significant result is a finding, not a failure, and it is entirely defensible when your method was sound. What is not defensible is adjusting the data until something turns significant.

    Do I need to have finished the analysis before writing anything?

    You need the tables finished before writing the paragraphs about them, but you can write the chapter’s opening paragraph — the return rate and what the chapter contains — as soon as you know your final respondent count.

    My supervisor is not responding. Should I wait?

    No. Build the tables and draft the paragraphs, then send a complete draft. A supervisor with something concrete in front of them responds faster than one asked an open question, and you lose nothing if a table has to change.

    What if I lost some questionnaires?

    Report the three counts honestly — administered, retrieved, usable — and let the return rate be whatever it is. A disclosed shortfall is a limitation; a concealed one is a defect a panel finds by adding up your table.

    Is it too late if my defence is in two weeks?

    No, if your data is collected. Four evenings of structured work produces a defensible Chapter Four, and Chapter Five is written from Chapter Four without adding anything new. Start with the encoding tonight.

    Should I write Chapter Five before or after Chapter Four?

    After, always. Chapter Five summarises what Chapter Four found. Writing it first means writing conclusions from expectations rather than from data, and a panel can tell.

  • How to Write Chapter Four of a Final Year Project in Nigeria: Data Presentation, Analysis and Interpretation (2026)

    How to Write Chapter Four of a Final Year Project in Nigeria: Data Presentation, Analysis and Interpretation (2026)

    Chapter Four is where a final year project stops being reading and starts being evidence. Most Nigerian departments title it Data Presentation, Analysis and Interpretation, and most students write it the same wrong way: they collect the questionnaires, run everything they can think of, paste the output in, and then try to build sentences around whatever appeared.

    The chapter is written one table at a time, in the order of your research questions, and nothing that answers no research question belongs in it. What follows is that procedure in eight steps, with the actual tables and sentences you will need.

    One thing outranks everything below: your department’s project guidelines. Departments at UNILAG, Ibadan, ABU Zaria, OAU and Nsukka differ on table numbering, on whether hypotheses are tested inside Chapter Four or Chapter Five, and on whether a decision rule must be stated in words. Where this guide and your handout disagree, follow the handout.

    Step 1: Rebuild the chapter outline from your research questions

    Output: a numbered sub-section list matching your Chapter One, written before you open any data.

    1. Open Chapter One and copy out the research questions in order, exactly as worded.
    2. Give each one its own sub-heading in Chapter Four, in the same order.
    3. Beside each, note the single table that will answer it.
    4. Add one sub-section per hypothesis, after the research questions.
    5. Delete every piece of output not assigned to a heading.

    Four research questions means four tables plus one per hypothesis. If you have eleven tables, several of them are answering nothing, and a panel member will ask why you ran them. The alignment between what you asked and what you answer is the thing being examined — the same alignment described in the guide to writing Chapter One.

    Step 2: Fix the return rate, and never change the number again

    Output: three counts, and one of them used everywhere afterwards.

    Chapter Four opens by saying how many questionnaires went out, how many came back, and how many were usable. Write it once, plainly:

    “A total of 250 copies of the questionnaire were administered to respondents in the five departments studied. Of these, 236 copies were retrieved and 231 were properly completed and used for the analysis, giving a return rate of 92.4%. The analysis in this chapter is therefore based on 231 respondents.”

    That last number is the one that appears in every table note, in the abstract, and in any percentage you compute. A respondent count that reads 231 in one table and 236 in another is the single most commonly caught defect in Nigerian project defences, and it costs you credibility on every other figure in the chapter. How you arrived at those counts belongs in Chapter Three, not here.

    Step 3: Present the bio-data as a frequency and percentage table

    Output: one table covering the respondent profile, and one short paragraph under it.

    The demographic section is descriptive only. It uses frequency and simple percentage, nothing else.

    Table 1: Distribution of Respondents by Demographic Characteristics

    Variable Category Frequency Percentage (%)
    Sex Male 128 55.4
    Female 103 44.6
    Level 300 Level 74 32.0
    400 Level 92 39.8
    500 Level 65 28.2
    Age Below 25 years 167 72.3
    25 years and above 64 27.7

    Source: Field Survey, 2026. n = 231.

    Two rules. Every block of percentages sums to 100 against your N, so check the arithmetic before the panel does. And keep the paragraph underneath short — the bio-data is context, not a finding, and a page of prose about how many respondents were male tells the reader nothing they cannot see.

    A printed frequency and percentage table with a handwritten interpretation in the margin
    One table, one finding, one paragraph. If you cannot underline the row your paragraph is about, the paragraph is not about anything.

    Step 4: Build the mean table for each research question

    Output: one table per research question, with mean, standard deviation and a decision column.

    Most Nigerian undergraduate instruments use a four-point scale: Strongly Agree 4, Agree 3, Disagree 2, Strongly Disagree 1. The criterion mean is 2.50, because the four scale points average to 2.50 — an item at or above it is Accepted, below it is Rejected. If your department uses a five-point scale, the criterion is 3.00 by the same arithmetic. State whichever you used, and where it came from, in the note under the table.

    Table 2: Effect of Power Supply on Student Study Hours

    S/N Item Mean SD Decision
    1 Irregular power supply reduces my evening study hours 3.42 0.71 Accepted
    2 I rely on a generator or power bank to study at night 3.18 0.84 Accepted
    3 I use the departmental reading room when there is no light at home 2.87 0.92 Accepted
    4 Power supply has no effect on how long I study 1.94 0.88 Rejected
    Grand Mean 2.85 0.84 Accepted

    Source: Field Survey, 2026. n = 231. Criterion mean = 2.50.

    Carry the standard deviation next to every mean. A mean of 3.42 with an SD of 0.71 describes a group that broadly agrees; the same mean with an SD of 1.40 describes a group that is split, and a panel may well ask which one you have. Item 4 above is reverse-worded on purpose — note that it was rejected, which is consistent with the other three rather than contradicting them.

    Step 5: Write the interpretation paragraph, in three moves

    Output: one paragraph under each table that does not simply retype the table.

    If your prose reads “from Table 2 above, item 1 has a mean of 3.42, item 2 has a mean of 3.18, item 3 has a mean of 2.87”, you have transcribed the table and said nothing. Every paragraph needs three moves:

    1. State the finding. The highest and lowest items and the overall picture, in one sentence.
    2. Say what it means in your setting — your department, your campus, your respondents.
    3. Connect it to Chapter Two. One named study your finding agrees or disagrees with.

    Worked paragraph:

    “Table 2 shows a grand mean of 2.85 against a criterion mean of 2.50, indicating that respondents generally agree that power supply affects their study hours. The strongest agreement was on the reduction of evening study hours (M = 3.42, SD = 0.71), while the claim that power supply has no effect was rejected (M = 1.94, SD = 0.88). This suggests that the constraint is felt most acutely at night, which is consistent with the reliance on generators and power banks reported in item 2, and with the departmental reading room serving as the fallback rather than the first choice. Adeyemi (2023) reported a similar pattern among undergraduates in a comparable state university, although the reliance on alternative power sources in the present study is higher.”

    The third move is the one almost always missing, and its absence is why a supervisor writes “no discussion” in the margin. The studies you compare against come from your literature review, and every author you name here must appear in your reference list in the style your department requires — the conventions are in the guide to referencing a Nigerian university project in APA.

    Step 6: Test each hypothesis and write the decision sentence

    Output: one sub-section per hypothesis, each ending in an explicit decision.

    Hypothesis sub-sections have a fixed shape, and panels test it because it is short enough to check line by line. State the hypothesis, present the table, state the decision.

    Worked example:

    Ho₁: There is no significant relationship between power supply and student study hours.

    “The chi-square test returned a calculated value of 18.42 with 4 degrees of freedom at the 0.05 level of significance, against a critical table value of 9.488. Since the calculated value (18.42) is greater than the critical value (9.488), the null hypothesis is rejected. There is therefore a significant relationship between power supply and student study hours.”

    Many Nigerian departments still teach the calculated-versus-critical-value comparison, while statistical software reports a p-value instead. The two agree: a calculated value above the critical value corresponds to a p-value below 0.05. If your output gives you p, the equivalent sentence is “χ²(4, N = 231) = 18.42, p = .001; the null hypothesis is rejected.” Use whichever form your department teaches, and use only one of them throughout the chapter.

    Two wordings a panel will correct on the spot. You reject or fail to reject a null hypothesis — you never accept it and you never prove it. And a significant result is not automatically a large or important one, so the sentence after the decision should say what the relationship means in practice.

    A Nigerian student explaining a results table to a seated project supervisor
    Take the tables to your supervisor before you write the prose. A wrong table costs an afternoon; a chapter written around a wrong table costs a week.

    Step 7: Report the numbers the way the style requires

    Output: one pass over every figure in the chapter.

    Nigerian departments overwhelmingly use APA, and its rules on numbers are narrower than most students realise. From the APA Style numbers and statistics guidance:

    1. Decimal places. Means and standard deviations from an integer scale — your four-point questionnaire — take one decimal in APA’s own convention, although many Nigerian departments require two. Follow your department, but be consistent across every table.
    2. Leading zeros. Include the zero before the decimal point only when the statistic can exceed 1. A correlation, a proportion and a p-value cannot, so write r = .42 and p = .03, not 0.42.
    3. Exact p values to two or three decimals, except below .001, where you write p < .001.
    4. Numerals for 10 and above and for every number used in a statistic; words for zero to nine and for any number that opens a sentence.
    5. Do not repeat a statistic in both the text and a table. Quote only the figures your argument turns on.
    6. Statistical symbols are italicM, SD, r, p, N — and never need defining. ANOVA and CI do.

    Step 8: Reconcile before you submit

    1. Questions equal sub-sections. Four research questions, four sub-sections, same order, same wording.
    2. Tools equal tables. Every tool named in Chapter Three produces a table here, and no table comes from a tool you never named.
    3. One N everywhere. Chapter Three, every table note, and the abstract.
    4. Every table is mentioned by number in the text at least once.
    5. Every hypothesis has a decision stated in words, not just a table.

    Then run the spoken test: can you state each finding in one sentence without looking at the page? That is precisely what you will be asked to do, and the standard inventory of what else gets asked is in the guide to what questions are asked during a project defence. How the whole document fits together is summarised in how many chapters a final year project has.

    You have the data. Now build the chapter.

    Tesify holds your chapters in the structure your department expects and keeps every citation attached to a source you actually opened, so the week after data collection goes into interpretation instead of formatting. Over 9,000 students have used it to write more than 15,000 chapters, and every word is still written by you.

    Build your Chapter Four in Tesify

    Frequently asked questions

    How do I write chapter four of a project?

    Create one sub-section per research question, in the order they appear in Chapter One. Under each, place one table and a paragraph that states the finding, explains it in your setting and compares it with a study from Chapter Two. Then add one sub-section per hypothesis, each ending in an explicit decision.

    What is chapter four of a project called?

    Most Nigerian departments title it “Data Presentation, Analysis and Interpretation” or “Presentation and Analysis of Data”. Check your department’s project guidelines, because the exact wording is usually prescribed.

    What is the criterion mean for a four-point scale?

    2.50, being the average of 4, 3, 2 and 1. An item at or above 2.50 is accepted and one below it is rejected. On a five-point scale the criterion is 3.00.

    How many tables should chapter four have?

    Roughly one per research question, plus one per hypothesis, plus the bio-data table. Most Nigerian undergraduate projects land between five and nine. A chapter with fifteen tables usually means software output was pasted in rather than selected.

    Do I put the standard deviation in the table?

    Yes. The mean alone does not tell the reader whether respondents agreed with each other, and a panel can reasonably ask for the spread. Report it beside every mean.

    Should hypotheses be tested in chapter four or chapter five?

    Chapter Four in most Nigerian departments, with Chapter Five reserved for the summary, conclusion and recommendations. Some departments differ, so follow your handout.

    Can I say I accepted the null hypothesis?

    No. Say you failed to reject it, or that it was not rejected. Not finding evidence of a relationship is not evidence that no relationship exists, and this is corrected in almost every defence where it appears.

    What does the decision rule mean in hypothesis testing?

    It is the stated basis on which you accept or reject: either the calculated value against the critical table value at your degrees of freedom, or the p-value against 0.05. Both are valid; state which you used and use only that one throughout.

    Do I discuss my findings in chapter four or chapter five?

    Where your department says. Many Nigerian projects place a discussion of findings at the end of Chapter Four and keep Chapter Five for the summary and recommendations. What matters is that the discussion exists somewhere and compares your findings with the literature.

    What if my findings contradict the studies in chapter two?

    Report it plainly and explain it from your setting — a different population, a different period, a different instrument. A contradiction that is explained is a contribution; one that is quietly omitted is a defect a panel finds by reading your Chapter Two.

    Do recommendations go in chapter four?

    No. Chapter Four presents and interprets what the data showed. The moment you start telling the department what it should do, you have crossed into Chapter Five.