Tag: statistics

  • How Much Research Do Nigerian Universities Publish? (2026)

    How Much Research Do Nigerian Universities Publish? (2026)

    Nigerian research output has nearly tripled in a decade: 16,560 works with a Nigerian institutional affiliation were indexed for 2015, against 46,381 for 2024 — a 2.8-fold rise. Every figure below was queried directly from the OpenAlex API on 17 August 2026, and the institutional leaderboard comes with a verified defect that means you cannot cite it as printed.

    The national figures, year by year

    Publication year Works with a Nigerian institutional affiliation Source and date read
    2015 16,560 OpenAlex API, 17 Aug 2026
    2016 18,064 OpenAlex API, 17 Aug 2026
    2017 21,150 OpenAlex API, 17 Aug 2026
    2018 25,271 OpenAlex API, 17 Aug 2026
    2019 30,955 OpenAlex API, 17 Aug 2026
    2020 39,984 OpenAlex API, 17 Aug 2026
    2021 42,779 OpenAlex API, 17 Aug 2026
    2022 42,400 OpenAlex API, 17 Aug 2026
    2023 45,115 OpenAlex API, 17 Aug 2026
    2024 46,381 OpenAlex API, 17 Aug 2026

    Three features of that series are worth stating carefully before anyone quotes it.

    The growth is real and large. 2024 is 2.8 times the 2015 figure, and the steepest single jump is 2019 to 2020, where output rose by roughly nine thousand works in one year.

    It is not monotonic. 2022 came in at 42,400 against 42,779 for 2021 — a small decline. If you present this series as uninterrupted growth, a careful reader will find the one year that is not.

    The most recent years are not comparable. The same query returned 58,829 works for 2025 and 55,537 for 2026 — a year that was seven and a half months old when the query ran. A 2026 count already approaching the 2025 total in August is telling you about how records enter the index, not about Nigerian productivity. Use 2024 as your most recent settled year, and say why.

    Open access: four fifths of it

    Of the 46,381 works indexed for 2024, 37,165 are flagged open access — 80.1 per cent.

    That figure has a direct practical consequence for a final year student whose university library subscription is thin: roughly four in five recent Nigerian-affiliated papers should be readable without paying for them. It does not mean one search box will surface them all, which is why the databases you search and the way you record those searches matter — a point covered in the guide to writing Chapter Two.

    A notebook page recording a statistic alongside its source name and the date it was read
    Write every figure down with its source and the date you read it. These are live indexes, and a number without a date stops being checkable.

    The institutional table, and why it carries a warning

    OpenAlex lists 269 Nigerian institutions of type “education”. Ranked by the works count recorded on each institution’s own record:

    Institution Works count Citations Citations per work
    University of Ibadan 52,306 1,472,499 28.2
    University of Nigeria 38,144 756,538 19.8
    Edo State University Uzairue 31,682 28,873 0.9
    University of Lagos 28,403 513,424 18.1
    Obafemi Awolowo University 28,017 599,259 21.4
    Ahmadu Bello University 25,037 527,031 21.1

    Read from the OpenAlex institutions endpoint on 17 August 2026. Citations per work computed from the two preceding columns.

    Read down the last column. Five of the six sit between 18 and 28 citations per work, which is a normal range for a large Nigerian university. One sits at 0.9 — roughly twenty times below its neighbours. That is not a finding about research quality. It is a signal that the row is wrong.

    The defect, and how to check it yourself in two minutes

    Every institution record carries a headline works count. You can also ask the works endpoint how many works it holds for that same institution. The two should broadly agree. Re-deriving each figure that way, on the same day, gives this:

    Institution Institution record says Works endpoint returns Difference
    University of Ibadan 52,306 46,723 −11%
    University of Nigeria 38,144 33,393 −12%
    University of Lagos 28,403 25,531 −10%
    Edo State University Uzairue 31,682 2,199 −93%

    Three of the four cluster between −10 and −12 per cent, which is consistent with ordinary indexing lag and is nothing to worry about. The fourth is a 14.4-fold discrepancy.

    To be clear about what this is not: the institution is real. The ROR registry, the authoritative register of research organisation identifiers, confirms that ror.org/049ajby27 is Edo State University Uzairue — also known as Edo University Iyamho — established in 2016, located in Auchi, Nigeria, with active status. A young university founded in 2016 has not published 31,682 works. This is a counting artefact in the index, not a fake record and not a claim about the institution.

    The rule that follows: an institutional works count is a starting point, never a citable figure. If your Chapter One needs to say how much a named Nigerian university publishes, re-derive the number from the works endpoint, and state the date you did it.
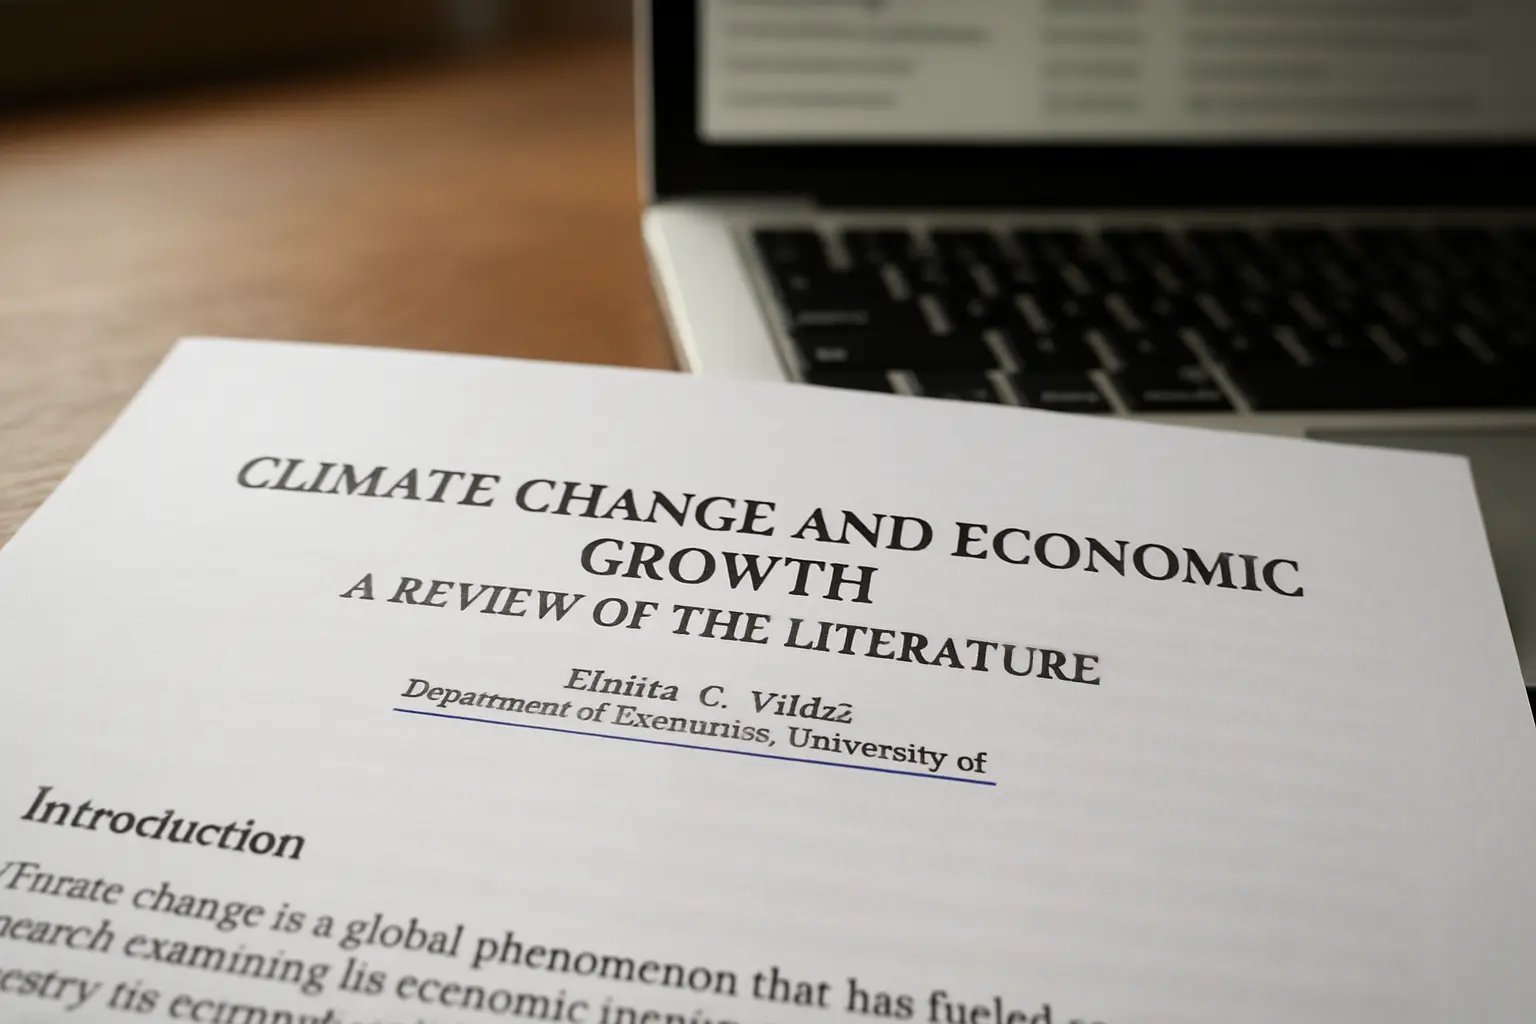
    The first page of a printed journal article with the author affiliation line underlined
    The two-minute check: open a few of the works credited to an institution and read the affiliation line on each.

    How to cite these figures without overstating them

    1. Name the source and the date you read it. These are live indexes, not annual publications. “OpenAlex, queried 17 August 2026” is the honest form.
    2. Stop at 2024. Say explicitly that later years are incomplete, and if you show a partial figure, label it.
    3. Prefer national counts to institutional ones. The country filter behaved consistently in every check above. The institution records did not.
    4. Do not turn a count into a quality claim. Volume says nothing about whether research is good, and it is heavily driven by institution size and discipline mix. A panel will make that point if you do not.
    5. Never mix vintages. A 2024 count from one source beside a 2019 count from another does not belong in one sentence without both dates attached — the same discipline that applies to the enrolment figures in how many university students there are in Nigeria.

    What this is actually useful for in your project

    Two things, and neither is padding your background with a big number.

    A rationale. If Nigerian output nearly tripled in a decade while the literature on your specific topic stayed thin, that contrast is a real justification for your study and it is far stronger than an unsupported assertion that “few studies have been conducted”. Where that argument belongs is set out in the guide to writing Chapter One.

    A measure that is not the one everybody else uses. Output is the third distinct measure of the Nigerian university system, alongside the institution count covered in how many NUC-accredited universities there are and the enrolment figures. Counting institutions, counting students and counting publications answer three different questions, and a background section that conflates them is a background section a panel will unpick.

    What none of it replaces is reading the papers. A count tells you how much exists; only reading tells you what it found — and that distinction is exactly what a panel is testing when it asks what a source you cited actually concluded.

    Keep every figure attached to the source you read it from

    Tesify holds your chapters in the structure your department expects and keeps each citation tied to the source you actually opened, so a figure in Chapter One can still be traced at the defence. Over 9,000 students have used it to write more than 15,000 chapters, and every word is still written by you.

    Draft your background section in Tesify

    Frequently asked questions

    How many research papers do Nigerian institutions publish each year?

    46,381 works with a Nigerian institutional affiliation were indexed for 2024, according to an OpenAlex query run on 17 August 2026. The 2015 figure was 16,560, so output rose 2.8-fold across the decade.

    Which Nigerian university publishes the most research?

    University of Ibadan leads, with 52,306 works on its OpenAlex record and 46,723 returned by the works endpoint. Treat the rest of the leaderboard carefully — at least one high-ranked row is inflated roughly fourteenfold.

    Why does Edo State University Uzairue rank so high?

    Because of a counting artefact. Its institution record shows 31,682 works while the works endpoint returns 2,199, a 14.4-fold gap, and its citations-per-work ratio of 0.9 is about twenty times below comparable universities. ROR confirms it is a real university established in 2016 in Auchi, so the institution is genuine and the number is not.

    What proportion of Nigerian research is open access?

    80.1 per cent of the 46,381 works indexed for 2024 are flagged open access — 37,165 of them. That is the practical reason a student with a thin library subscription can still build a current literature review.

    Can I cite OpenAlex in my project?

    Yes, as a database, naming it and the date you queried it. What you should not do is cite an institutional works count you have not re-derived from the works endpoint.

    Why is the 2026 figure almost as high as 2025?

    Because indexing is not synchronised with the calendar and recent years keep changing. A partial-year count approaching a full previous year is an artefact of how records enter the index, so use 2024 as your most recent settled figure.

    Did Nigerian research output ever fall?

    Once in the decade shown: 2022 returned 42,400 works against 42,779 for 2021. It is a small dip, but present it accurately rather than describing the series as uninterrupted growth.

    Does a high publication count mean a university is better?

    No. Count measures volume, not quality, and it is strongly influenced by institution size and discipline mix. Sliding from one to the other is the first thing a panel will pick up.

    How do I check an institutional figure myself?

    Query the works endpoint for that institution and compare the total against the number on the institution record. If they disagree by much more than about ten per cent, use the works-endpoint figure and say so.

    How many universities does OpenAlex list for Nigeria?

    269 Nigerian institutions of type “education” as at 17 August 2026. That is an index count and is not the same thing as the number of NUC-accredited universities, which is counted on a different basis.

    Where do these numbers belong in my project?

    In Chapter One, as background establishing why the study matters, or in Chapter Two as context for the state of the literature. They are not findings, so they do not belong in Chapter Four.


  • Graduate Unemployment in Nigeria: The Figures Your Chapter One Should Actually Cite (2026)

    Graduate Unemployment in Nigeria: The Figures Your Chapter One Should Actually Cite (2026)

    Nigerians with advanced education faced 9.2% unemployment in 2024, against a national rate of 3.04% in the same year — roughly three times higher.

    That inversion is the single most useful labour-market fact a Nigerian final year project can carry, and almost no Chapter One states it. Most quote a general unemployment figure, often a double-digit one from an older series, and never separate graduates from the labour force as a whole.

    Every figure below was read directly from the World Bank indicator API on 18 August 2026. Each series carried a lastupdated stamp of 13 July 2026, which is the date to cite alongside the number.

    The headline figures

    Indicator Latest value Year Source
    Unemployment with advanced education (% of labour force with advanced education) 9.2% 2024 World Bank, SL.UEM.ADVN.ZS (updated 13 Jul 2026)
    Unemployment, total (modelled ILO estimate) 3.04% 2024 World Bank, SL.UEM.TOTL.ZS (updated 13 Jul 2026)
    Unemployment, total (national estimate) 3.45% 2024 World Bank, SL.UEM.TOTL.NE.ZS (updated 13 Jul 2026)
    Youth unemployment, ages 15–24 (modelled ILO estimate) 5.09% 2024 World Bank, SL.UEM.1524.ZS (updated 13 Jul 2026)

    Read the first two rows together. Whatever you believe about the absolute level, the ratio is the finding: education does not shield you from unemployment in the Nigerian labour market on these figures — it is associated with a rate three times the national one.

    That is a rationale for an enormous number of Nigerian project topics: graduate employability, entrepreneurship education, skills mismatch, curriculum relevance, industrial training. If your project sits in any of those areas, this is your background paragraph.

    The graduate series, year by year

    Year Unemployment with advanced education (%)
    2016 14.51
    2019 11.16
    2022 6.72
    2023 6.17
    2024 9.20

    Note two things a careful supervisor will notice. The series is gappy — there are no values for 2017, 2018, 2020, 2021 or 2025 — so you cannot draw a continuous line through it. And it moves substantially between adjacent published years, rising from 6.17% to 9.20% between 2023 and 2024.

    Quote individual years with their year attached. Do not describe this as a trend.

    A recent Nigerian graduate scrolling job listings on a laptop with a printed CV beside the keyboard
    The graduate rate and the national rate are different measures of different populations. Most Chapter Ones cite only the second.

    🔴 Why the number you remember is much higher

    If you have a Nigerian unemployment figure in your head, it is probably in double digits, and you will find double-digit figures throughout the literature you are about to cite. Here is what the series actually shows.

    Year Modelled ILO estimate (%) National estimate (%)
    2014 3.90 4.56
    2016 4.50 7.06
    2017 4.83 8.39
    2019 5.21 4.45
    2020 5.71
    2021 5.40
    2022 3.83 3.83
    2023 3.07 3.07
    2024 3.04 3.45
    2025 3.06

    Two features matter for your manuscript.

    The national estimate breaks. It reports 8.39% in 2017 and 4.45% in 2019, then 3.07% in 2023. A halving and more, with gaps in between. A series that moves like that has had something change in how it was produced.

    The two series diverge and then converge. In 2017 the modelled and national estimates were 4.83% and 8.39% — nearly two-fold apart. By 2022 and 2023 they report identical values. Two measures agreeing exactly, after years of disagreeing substantially, is itself a signal about the underlying source.

    This article does not assert why. Nigeria’s national statistics office would be the place to check, and nigerianstat.gov.ng refused the connection entirely when this article was prepared — not a 403, no response at all. So the cause is not stated here, because it could not be verified, and you should not accept it from a secondary source either.

    What you can and should do is state precisely what you are citing:

    Nigeria’s unemployment rate stood at 3.04% in 2024 (World Bank, SL.UEM.TOTL.ZS, modelled ILO estimate, updated 13 July 2026), while unemployment among those with advanced education was 9.2% in the same year (World Bank, SL.UEM.ADVN.ZS). Figures on earlier national bases are substantially higher and are not directly comparable.

    That sentence cannot be broken by a panellist opening the dataset, because it says exactly which series, which year and which basis. “Nigeria’s unemployment rate is 33%” can be broken in about fifteen seconds.

    Reading older literature without importing its numbers

    You will cite Nigerian studies from 2018 to 2023 that quote unemployment figures far above these. That is not a reason to avoid them, and it is not a reason to repeat their numbers as current.

    The convention that works:

    1. Cite the study for its findings, which are about its respondents and remain valid.
    2. Attribute any figure to the study’s own year and basis — “Adeyemi (2021) reported an unemployment rate of X per cent, on the basis then in use”.
    3. Use the current series for any claim you make in your own voice, with the year and indicator attached.
    4. Say once, explicitly, that the bases differ, so a reader does not think you have contradicted yourself.

    That fourth step is the one students skip, and it is what turns an apparent inconsistency into evidence of care. The synthesis method that keeps this straight across a whole chapter is in the guide to writing Chapter Two.

    Youth unemployment is a different population again

    Year Youth unemployment, ages 15–24 (%)
    2019 10.42
    2020 10.84
    2021 8.99
    2022 6.02
    2023 5.13
    2024 5.09
    2025 5.34

    Students routinely use “youth unemployment” and “graduate unemployment” interchangeably. They are not the same measure. The 15–24 age band includes people who never entered tertiary education and excludes most people who completed a degree and a service year, so it is the wrong series for a project about graduates.

    Use SL.UEM.ADVN.ZS for graduates. Use the youth series only if your study is actually about young people as an age group.

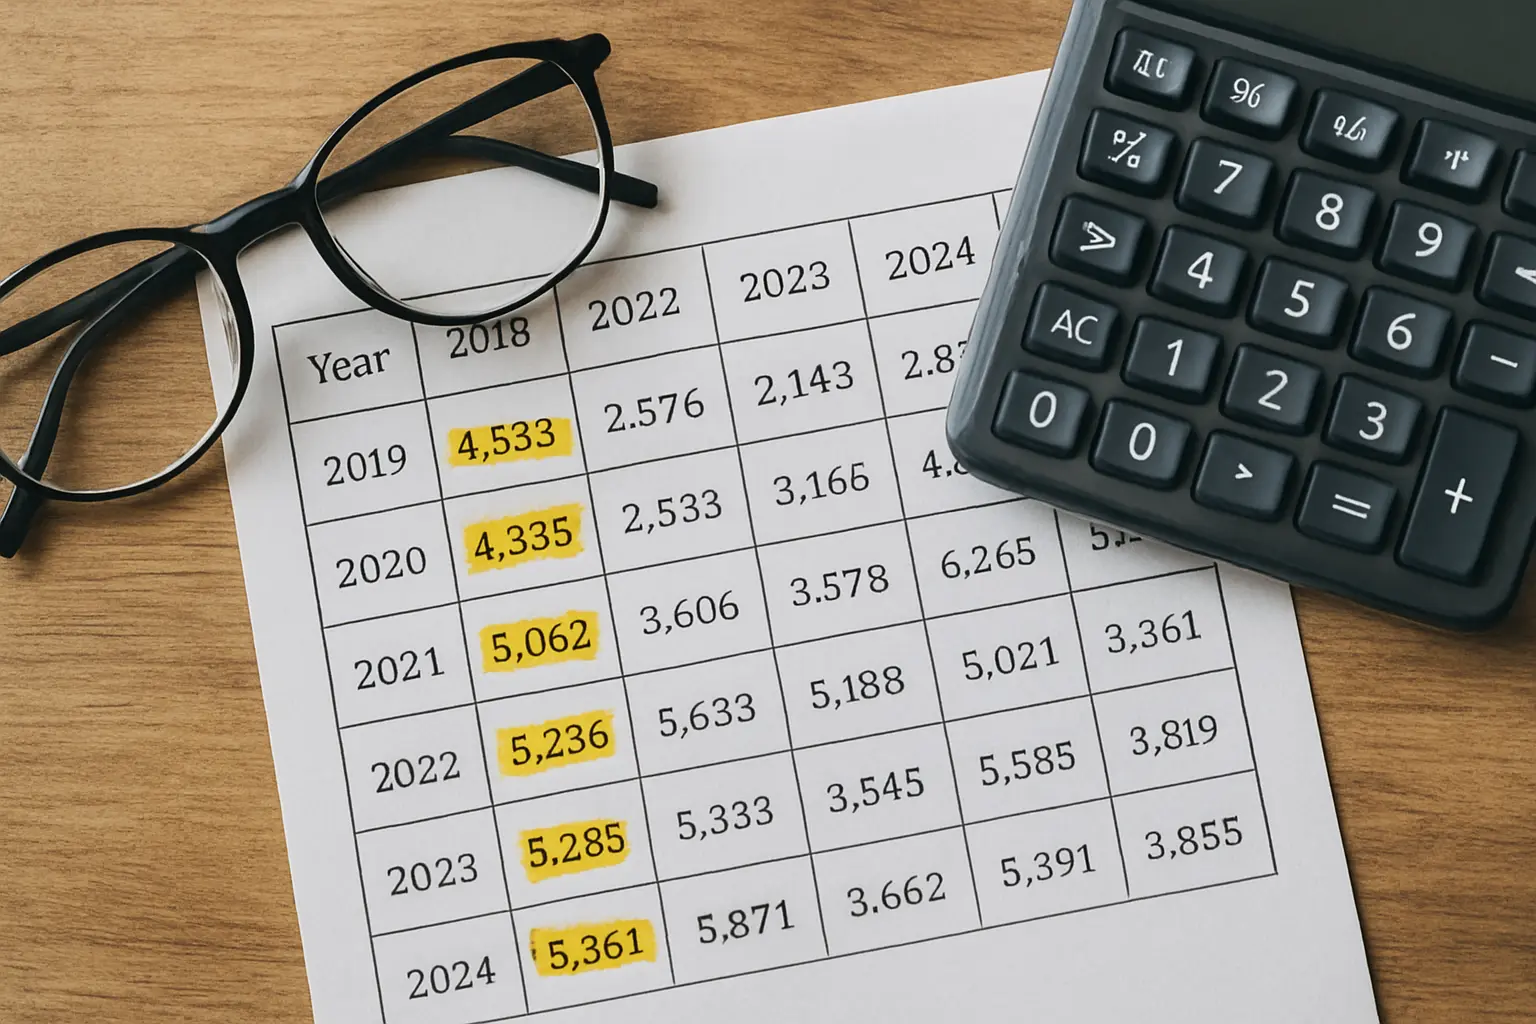
    A printed statistical table with figures highlighted and the year column marked in pen beside a calculator
    Mark the year column before you quote anything. Most citation errors in a Chapter One are year errors, not arithmetic ones.

    🔴 What the World Bank does not have for Nigeria

    This is worth stating so you stop searching, and it is a finding in its own right.

    Checked live on 18 August 2026, the World Bank publishes for Nigeria:

    • No tertiary gross enrolment ratio at all (SE.TER.ENRR returns no values).
    • No tertiary graduate count (SE.TER.GRAD returns no data).
    • No tertiary enrolment total (SE.TER.ENRL returns no values).
    • No tertiary pupil–teacher ratio (SE.TER.ENRL.TC.ZS returns no values).

    So there is no national graduation rate to cite from this source, and a project that needs one has to say so rather than substitute something adjacent.

    One tertiary indicator does return values, and it is a cautionary example rather than a usable figure. Educational attainment, at least a bachelor’s degree (SE.TER.CUAT.BA.ZS), reports: 2021 10.97% · 2022 3.48% · 2023 3.80% · 2024 10.57%. A measure of completed degrees cannot fall by two-thirds and then triple in three years. That is survey-to-survey variation, not the world changing, and it must never be quoted as a trend or as a point estimate without that caveat.

    For institution counts and enrolment, use the Nigerian sources instead — the register is covered in how many universities there are in Nigeria and enrolment in how many university students Nigeria has. Admissions are covered in the article on JAMB’s 2026 minimum admission scores.

    How to check any of this yourself

    The World Bank indicator API is open, needs no key, and returns JSON in a browser:

    https://api.worldbank.org/v2/country/NG/indicator/SL.UEM.ADVN.ZS?format=json&date=2014:2026

    Swap the code for SL.UEM.TOTL.ZS, SL.UEM.TOTL.NE.ZS or SL.UEM.1524.ZS to reproduce every table here. The response carries a lastupdated field, which is the date you cite.

    Run the query yourself rather than copying a figure from another project. It takes a minute, it gives you the current value, and it means you can answer “where did that number come from?” with a URL instead of a shrug — which is exactly the kind of question a project defence produces. The same discipline applies to the connectivity figures in student internet access in Nigeria.

    Keep every figure attached to the source you opened

    Tesify keeps citations attached to the sources you actually opened while you draft, so a background section built on national statistics can be traced line by line when a panel asks where a number came from. Over 9,000 students have used it to write more than 15,000 chapters, and 100 per cent of the work is still written by you.

    Draft your Chapter One in Tesify

    Frequently asked questions

    What is the graduate unemployment rate in Nigeria?

    Unemployment among those with advanced education was 9.2% in 2024, according to World Bank indicator SL.UEM.ADVN.ZS as updated on 13 July 2026. That is roughly three times the national rate of 3.04% in the same year.

    Why is the national rate so much lower than I expected?

    The published series reports 3.04% for 2024 on the modelled ILO estimate and 3.45% on the national estimate, while earlier years on the national basis are much higher — 8.39% in 2017. Something changed in how the figure is produced. This article does not assert what, because Nigeria’s national statistics office could not be reached to verify it.

    Can I still cite the higher figures from older studies?

    Yes, attributed to their own year and basis. Cite the study for its findings, attach the year to any figure you take from it, and use the current series for claims you make in your own voice. Say once that the bases differ.

    Is youth unemployment the same as graduate unemployment?

    No. The youth series covers ages 15 to 24 regardless of education and was 5.09% in 2024. Most graduates are outside that band by the time they finish, and most of the band never entered university. Use the advanced-education series for graduates.

    What is a modelled ILO estimate?

    A figure produced on a harmonised international basis so that countries can be compared, as distinct from the national estimate reported on a country’s own definitions. The World Bank publishes both for Nigeria, and they have not always agreed.

    Is there a national graduation rate for Nigerian universities?

    Not from the World Bank. Its tertiary graduate, enrolment and gross enrolment ratio indicators all return no data for Nigeria. A project needing a graduation rate has to say the figure is unavailable rather than substitute an adjacent measure.

    Can I use the educational attainment indicator?

    Not as a point estimate or a trend. It reports 10.97% for 2021, 3.48% for 2022, 3.80% for 2023 and 10.57% for 2024, which is survey variation rather than real change. If you use it at all, quote a single year and state the volatility explicitly.

    How do I cite the World Bank in APA 7th?

    Treat it as a dataset with the World Bank as author, the indicator name as the title, the year, and the indicator or API URL. Do not put a period after the URL.

    Where do these figures belong in my project?

    Background of the study in Chapter One, where they establish the problem your project addresses. They do not belong in Chapter Four, which reports your own data. The section-by-section structure is in the guide to writing Chapter One, and the future-tense version for a proposal is in the guide to writing a research proposal.

    How often do these figures change?

    The World Bank restates its series periodically, and values are revised as well as extended. Re-run the query rather than reusing a figure saved earlier in the session — the gaps and jumps in these tables show exactly why.

    Should I use a percentage or an absolute number?

    Percentages, because these indicators are published as rates and converting them to headcounts requires a labour force denominator you would have to source separately and date consistently. A rate with its year and indicator is defensible; a derived headcount usually is not.