Tag: sample size

  • Sample Size for an Agriculture Project in Nigeria: Where the Farmer Population Figure Actually Comes From (2026)

    Sample Size for an Agriculture Project in Nigeria: Where the Farmer Population Figure Actually Comes From (2026)

    The headline problem is this: the Taro Yamane formula that every Nigerian agriculture department expects you to use requires a finite population size, N, and for farmers in a given local government area, no register exists that anyone can hand you on request. Students solve this by writing a round number into Chapter Three and hoping nobody asks. Panels ask.

    This piece does two things. First, it names the five sources a Nigerian student can actually cite for a farming population figure, with the vintage of each one stated plainly, because several of the official figures are older than the students using them. Second, it works the calculation through from that figure to a defended, allocated sample.

    The five sources you can cite, and how current each one is

    Source What it gives you Level of detail Vintage caution
    National Agricultural Sample Census (NBS, with FAO support) Counts of agricultural households and holdings National and state Nigeria’s agricultural census exercises are infrequent; check the publication year on the report you cite and state it
    General Household Survey — Panel (NBS, with World Bank LSMS) Proportion of households engaged in agriculture National and zonal, not LGA Runs in waves; cite the wave and its reference year
    State Agricultural Development Programme (ADP) registers Registered farmers by block, cell and extension zone LGA and below — the most useful level Registers count registered farmers only, not all farmers
    FADAMA and other intervention beneficiary lists Named beneficiaries by community Community level Covers a scheme population, never the whole farming population
    LGA Department of Agriculture and cooperative unions Membership rolls, sometimes a local enumeration LGA and ward Quality varies enormously; get it in writing on letterhead

    Two rules follow from that table, and both of them are what a good examiner is listening for.

    Rule one: name the level your figure describes. A national proportion of agricultural households cannot be your N for a study of yam farmers in one LGA. It can support your background in Chapter One, but your population figure must come from the same level as your study area.

    Rule two: define your population by what your source actually counted. If your N came from an ADP register, then your population is registered farmers in that LGA, and you must say so in Chapter Three. Writing “the population of the study comprises all farmers in the LGA” when your number came from a register is a claim your own source does not support. Narrowing the population to match the source is not a weakness — it is precision, and it protects you.

    Getting an LGA-level figure in practice

    The route that works for most agriculture students takes about a week:

    1. Ask your supervisor for a letter of introduction addressed to the state ADP or the LGA Department of Agriculture. Departments issue these routinely.
    2. Visit the ADP zonal office covering your study area and ask for the number of registered farmers in the block or cell you are studying, broken down by ward if possible.
    3. Ask for it on letterhead, signed and dated. This becomes an appendix and it ends any argument about where your N came from.
    4. If the ADP cannot help, approach the LGA agriculture desk officer, then the local cooperative union or commodity association.
    5. Record the date you obtained the figure. You will cite it as a personal communication with that date.

    If every route fails and you genuinely cannot obtain a population figure, you have two honest options. Either switch to a sampling approach that does not require N — a purposive or quota sample, defended on its own terms — or state a documented estimate with its source and limitations, and add the limitation to Chapter Five. What you must not do is invent a number. An examiner who has worked in an ADP will recognise a fabricated register size instantly.

    The Taro Yamane calculation, worked

    Taro Yamane’s formula is the Nigerian standard for a finite population, far more common in undergraduate projects here than Cochran or Slovin:

    n = N ÷ (1 + N(e)²)

    where n is the sample size, N is the finite population, and e is the level of precision, conventionally 0.05 for a 95 per cent confidence level.

    Suppose the ADP zonal office confirms 4,300 registered farmers across the three wards of your study LGA. Then:

    • e² = 0.05 × 0.05 = 0.0025
    • N(e)² = 4,300 × 0.0025 = 10.75
    • 1 + 10.75 = 11.75
    • n = 4,300 ÷ 11.75 = 365.96

    Round up, never down: n = 366. Rounding down is one of the small errors that invites a correction, because a sample below the calculated minimum no longer carries the precision you claimed.

    Two adjustments are worth making before you go to the field. First, add an attrition allowance. Agriculture fieldwork loses questionnaires to rain, to farmers who are not on their plots, and to incomplete returns. Administering 400 to retrieve 366 is realistic; state the retrieval rate in Chapter Four. Second, if your analysis requires comparing subgroups — irrigated against rain-fed, male against female farmers — check that the smallest subgroup will still hold enough cases to analyse. Thirty per cell is a common working minimum.

    Allocating the sample across your wards

    A sample size is a number; a sampling procedure is a method. Chapter Three needs both, and this is where agriculture projects most often thin out.

    Use proportional allocation, sometimes called Bowley’s proportional allocation formula, so that each ward contributes in proportion to its share of the population:

    nh = (Nh × n) ÷ N

    Continuing the worked example with n = 366 and N = 4,300:

    Ward Registered farmers (Nh) Calculation Sample allocated (nh)
    Ward A 1,900 (1,900 × 366) ÷ 4,300 162
    Ward B 1,500 (1,500 × 366) ÷ 4,300 128
    Ward C 900 (900 × 366) ÷ 4,300 76
    Total 4,300 366

    Then state how individual farmers were selected within each ward — systematic sampling from the register at a fixed interval, or simple random selection from the list. A multistage description reads well for agriculture: state, then LGA, then wards, then farming households, with the selection method named at each stage.

    When Taro Yamane is the wrong tool

    Three situations where applying it anyway will cost you marks:

    • Your population is genuinely unknown. If no register exists at any level, you cannot compute a finite-population formula. Say so, and use a defensible alternative with a stated justification rather than dressing up a guess.
    • Your study is qualitative. In-depth interviews with extension officers or focus groups with farming cooperatives are sized by saturation, not by formula. What panels accept as a defence in that case is set out in the piece on how many respondents a qualitative project needs.
    • Your unit of analysis is not a person. Field trials, plot experiments, soil sample points and livestock units are sized by experimental design — replications and treatments — not by Yamane. An agronomy trial with four treatments and three replications needs a randomised complete block design, not a survey formula.

    What to write in Chapter Three

    A paragraph that survives questioning looks like this:

    The population of the study comprised 4,300 farmers registered with the [State] Agricultural Development Programme across the three wards of [LGA], as confirmed by the ADP zonal office on 14 March 2026 (see Appendix C). The sample size was determined using the Taro Yamane formula at a 95 per cent confidence level and 0.05 level of precision, giving a minimum sample of 366 respondents. A multistage sampling procedure was adopted. In the first stage, [LGA] was purposively selected because of its predominance of [crop] production. In the second stage, the three wards were included in full. In the third stage, the sample was allocated proportionally across the wards using Bowley’s formula, yielding 162, 128 and 76 respondents respectively. In the final stage, respondents were selected by systematic random sampling from the ADP register at an interval of every kth farmer. Four hundred questionnaires were administered to allow for attrition.

    Every claim in that paragraph is traceable. The population has a source and a date, the formula has a stated precision level, the allocation shows its arithmetic, and the selection method is named at each stage. It slots into the wider structure described in the guide to writing Chapter Three section by section.

    Two decisions that follow from your sample size deserve early attention. The instrument you administer to those 366 farmers has to be built and validated, and the sequence for that — expert review, content validity index, pilot, reliability coefficient — is the same one used in the guide to designing and validating a survey instrument. And how you administer it matters more in rural areas than anywhere else, because an online form measures who had network that day rather than who farms; the trade-offs are compared in the piece on collecting project data with Google Forms, KoboToolbox or paper.

    Two questions the panel will ask about your N

    “Where did this population figure come from?” Answer with the institution, the office, the date and the appendix number. Then stop talking. A precise sourcing answer closes the question.

    “Why 0.05 and not 0.01?” Because 0.05 corresponds to the 95 per cent confidence level conventional in social and agricultural survey research, and because 0.01 would have required a sample beyond the resources available for an undergraduate project. Saying the second half out loud is fine — examiners prefer an honest constraint to a pretended one.

    Get the chapter written while the figures are fresh

    The hardest part of an agriculture project is rarely the arithmetic. It is that fieldwork eats weeks, and by the time you return from the wards with four hundred questionnaires in a bag, the writing has not started and the deadline has not moved.

    Tesify drafts your chapters from your own topic, population, sampling procedure and instrument, keeps your citations and terminology consistent as the draft grows, and lets you revise a section after supervisor corrections without rebuilding the chapter. It is a way to write your own project faster, not a way to submit someone else’s.

    Start your project on Tesify for free and turn your sampling decisions into a finished Chapter Three.

    Frequently asked questions

    Where can I get the number of farmers in a Nigerian local government area?

    The most usable source is the State Agricultural Development Programme zonal office covering your study area, which keeps registers of farmers by block and cell. The LGA Department of Agriculture, FADAMA beneficiary lists and cooperative union rolls are alternatives. Request the figure on letterhead with a date, and reproduce it as an appendix — that document is what answers the panel’s question about your population.

    What is the Taro Yamane formula?

    n = N ÷ (1 + N(e)²), where n is the required sample size, N is the finite population and e is the level of precision, conventionally 0.05 for 95 per cent confidence. It is the standard sample size formula in Nigerian undergraduate projects and applies only when the population size is known.

    What sample size should I use if I cannot find the population of farmers?

    Do not apply Taro Yamane to a population you cannot document. Either use a formula for an infinite or unknown population, or adopt purposive or quota sampling with a stated justification and sample size, and record the absence of a sampling frame as a limitation in Chapter Five. Examiners accept a documented constraint; they do not accept an invented N.

    Should I round the Taro Yamane result up or down?

    Always up. The formula gives a minimum sample for your stated precision, so 365.96 becomes 366. Administering more than the calculated minimum is fine and normal; administering fewer means you no longer have the precision you claimed in Chapter Three.

    How do I share my sample across several villages or wards?

    Use proportional allocation: multiply each ward’s population by your total sample size and divide by the overall population, so that a ward holding forty per cent of the farmers receives forty per cent of the questionnaires. Show the arithmetic in a table in Chapter Three, and confirm the allocated figures add back to your total sample.

    Does Taro Yamane apply to a field experiment or plot trial?

    No. Experimental agronomy studies are sized by design — number of treatments, replications and blocks — not by a survey formula. A randomised complete block design with four treatments and three replications gives twelve plots, and the appropriate analysis is analysis of variance rather than descriptive survey statistics.

    How recent must my population figure be?

    As recent as the source allows, and always cited with its year. Several official Nigerian agricultural datasets are published years after their reference period, so state the reference year explicitly rather than implying the figure is current. An examiner respects “the most recent available figure, published in [year]” far more than an undated number.


  • How Many Respondents Do You Need for a Qualitative Final Year Project? (2026)

    How Many Respondents Do You Need for a Qualitative Final Year Project? (2026)

    There is no formula. A systematic review of empirical tests found studies reached saturation within 9 to 17 interviews, or 4 to 8 focus group discussions, where the population was homogenous and the objectives narrow. Ten to fifteen participants is defensible for a Nigerian undergraduate project — provided you can say how you arrived at it.

    Why can’t I use the Taro Yamane formula?

    Because it answers a different question.

    Taro Yamane estimates how many respondents you need in order to generalise a measurement from a known population within a stated margin of error. It requires a population figure, a numeric variable and a sampling frame, and it exists to control sampling error in a quantitative study.

    A qualitative project is not estimating a population value. It is trying to understand how something is experienced, why it happens, or what it means to the people involved. There is no margin of error to control, because there is no estimate. Substituting a population into a formula and reporting the answer produces a number that looks rigorous and justifies nothing.

    The formula and its worked computation belong in a quantitative Chapter Three, where they are covered in the guide to writing Chapter Three section by section. This article is about the other case.

    What do I say to a panel that expects a formula?

    This is the real problem, and it is worth naming plainly. Many Nigerian departments teach sample size almost entirely through Taro Yamane, Krejcie and Morgan, and Cochran. A panellist who has examined forty quantitative projects this session will ask you how you got your number, and “I did not calculate it” sounds like an admission.

    It is not one, and the answer that works is a positive statement rather than a defence. It has three parts:

    1. Name the different goal. “My study seeks depth of meaning rather than generalisation to the population, so sample size was determined by data saturation rather than by a sampling formula.”
    2. Cite the evidence. Name a published empirical study rather than asserting the practice — the two below are the standard references.
    3. Show your record. Produce the saturation table described further down. This is the qualitative equivalent of showing your Yamane computation, and it does the same job.

    A student who does all three is not conceding a weakness; they are demonstrating that they understand their own design. A student who mumbles “the supervisor said fifteen” is conceding one.

    What is data saturation?

    Saturation is the point at which collecting more data stops producing anything new — no new codes, no new themes, no new information relevant to your research questions.

    It is a stopping rule, not a target, and that distinction has a hard practical consequence: you cannot observe saturation if you conduct all your interviews first and analyse them afterwards. Saturation only becomes visible if you transcribe and code as you go, so you can watch the new codes taper off.

    A student who runs fifteen interviews in one week and codes them the following month has not reached saturation. They have run fifteen interviews and hope it was enough.

    A handwritten log tracking new themes found per interview, with zeros in the final rows
    Two columns per interview: themes so far, and new themes this time. When the second column reaches zero and stays there, you have an exhibit for the defence.

    What does the published evidence actually say?

    Two studies carry this question in the international literature, and one of them is unusually relevant to a Nigerian project.

    Guest, Bunce and Johnson (2006) analysed 60 in-depth interviews with women in two West African countries, documenting interview by interview when new themes stopped appearing. They reported that saturation occurred within the first twelve interviews, although the basic elements for metathemes were present as early as six. That West African fieldwork base is worth mentioning in your Chapter Three — it is a methodological study conducted in a context closer to yours than most of the literature you will cite.

    Hennink and Kaiser (2022) systematically reviewed studies that had empirically tested saturation, identifying 23 articles — 17 using empirical data and 6 using statistical modelling. Their finding was a narrow range: saturation within 9 to 17 interviews, or 4 to 8 focus group discussions, particularly in studies with relatively homogenous populations and narrowly defined objectives. Multi-country research and meta-theme analysis needed more.

    Source Basis Finding
    Guest, Bunce & Johnson (2006), Field Methods 18(1) 60 in-depth interviews, two West African countries Saturation within 12 interviews; metatheme elements by 6
    Hennink & Kaiser (2022), Social Science & Medicine 292 Systematic review of 23 empirical tests 9–17 interviews or 4–8 focus group discussions

    A typical Nigerian undergraduate qualitative project — one department or organisation, one fairly homogenous group, three research questions — sits squarely inside those conditions. Ten to fifteen participants, with a stated intention to continue until saturation, is a planning figure you can defend.

    Is saturation a settled idea?

    No, and knowing that protects you against a well-read panellist.

    Braun and Clarke, whose thematic analysis many Nigerian projects cite, published a direct challenge — “To saturate or not to saturate? Questioning data saturation as a useful concept for thematic analysis and sample-size rationales” — arguing that saturation fits awkwardly with an interpretive approach where meaning is generated by the analyst rather than sitting in the data in a fixed quantity.

    You do not need to settle that debate in an undergraduate project. What you must do is be internally consistent. If your Chapter Three says you used reflexive thematic analysis, do not also claim the data were exhausted. Say instead that recruitment continued until additional interviews were no longer generating material relevant to your research questions.

    How do I write the justification into Chapter Three?

    Four sentences. A filled-in version is more useful than a rule, so here is one you can adapt:

    Fifteen participants were selected through purposive sampling using the criteria stated above. Sample size was determined by data saturation rather than by a statistical formula, following empirical guidance that studies with homogenous populations and narrowly defined objectives commonly reach saturation between nine and seventeen interviews (Hennink & Kaiser, 2022). Transcription and coding were carried out concurrently with data collection so that the emergence of new themes could be monitored. No new themes were identified after the thirteenth interview; two further interviews were conducted to confirm this, and recruitment then closed.

    Those four sentences name the sampling method, state the basis for the size, explain how saturation was observable, and give the point at which it occurred plus the confirmation interviews. A bare “fifteen respondents were purposively selected” does none of that.

    How do I actually track saturation?

    Keep a log. It costs a few minutes per interview and it is the most convincing single exhibit you can bring to a defence.

    1. Transcribe each interview before the next one, or within a day at the latest.
    2. Code it and list every theme. For interview one, every theme is new.
    3. Record two numbers per interview: total themes so far, and new themes from this interview.
    4. Watch the second column. It falls steeply, flattens, then reaches zero.
    5. Run two more interviews after your first zero. A single zero can just be a similar participant.

    Put the completed table in your appendix and refer to it by number in Chapter Three. When a panellist asks how you knew you had enough, you turn to it — the same move as turning to a Yamane computation.

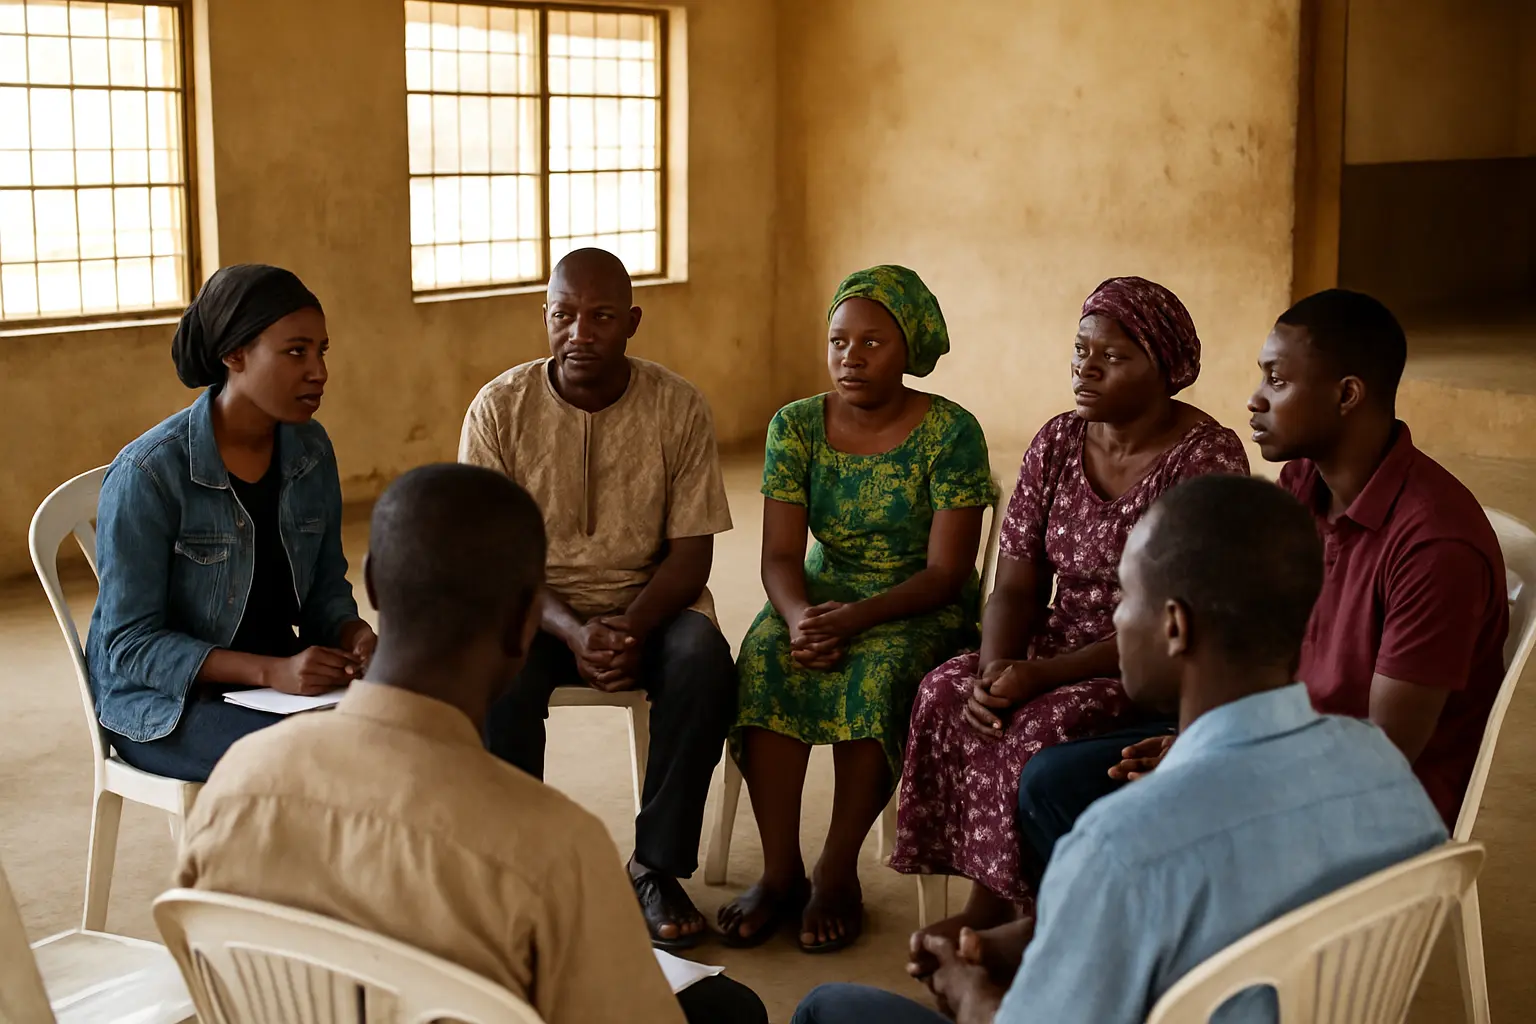
    Seven Nigerian participants seated in a circle for a focus group discussion led by a student moderator
    Count discussions, not heads. One group of seven is one focus group discussion, not seven interviews.

    Does the number change with my design?

    Yes, and one sentence about this in Chapter Three shows the panel you know which design you are running.

    • Phenomenology works with small, deeply engaged samples. Depth of each account is the point, not the count.
    • Case study is bounded by the case. The unit is the case, and you may interview several people about one of them.
    • Focus group designs count discussions, not people — the empirical range is 4 to 8 discussions. A group of eight participants is one discussion.
    • Grounded theory uses theoretical sampling: who you recruit next is decided by what the analysis so far suggests you still need, which makes the final number genuinely unknowable in advance.

    A project claiming grounded theory while recruiting a fixed sample in a single week has a mismatch, and it is the kind a methodologically minded lecturer finds quickly.

    What if my supervisor insists on a specific number?

    Use it, and justify it anyway.

    Departments and supervisors often set an expected range for undergraduate qualitative work. Your department governs you, and arguing methodology over a number is a poor use of the weeks you have left.

    What you can always do is write the justification regardless: “Fifteen participants were selected in line with departmental guidance; coding was conducted concurrently and no new themes emerged after the thirteenth interview.” The number came from the department, the defensibility came from you, and nobody is contradicted.

    What will the panel ask?

    Four questions, reliably. The wider question bank for a Nigerian defence is in the article on what questions are asked during a project defence.

    1. “Why fifteen?” Your stopping rule and your log, not a citation on its own.
    2. “How did you know you reached saturation?” This is what the log exists for.
    3. “How were the respondents selected?” Name the technique and the inclusion criteria. Never call purposive sampling random.
    4. “Can your findings be generalised?” No — say so plainly. Qualitative findings are transferable to similar contexts, not generalisable to a population, and claiming otherwise loses the room.

    Write the justification, not just the number

    Tesify structures your project chapter by chapter in the format your department expects and keeps every citation attached to a source you actually opened, so a methodology section that has to justify a sample reads like a decision rather than an assertion. Over 9,000 students have used it to write more than 15,000 chapters, and 100 per cent of the work is still written by you.

    Draft your Chapter Three in Tesify

    Frequently asked questions

    How many respondents do you need for a qualitative final year project?

    There is no formula. Published empirical tests converge on 9 to 17 interviews or 4 to 8 focus group discussions for studies with homogenous populations and narrow objectives. Ten to fifteen participants is defensible for a Nigerian undergraduate project provided you state how you determined it.

    Can I use Taro Yamane for a qualitative study?

    No. Yamane estimates the sample needed to generalise a measurement within a margin of error, which is a quantitative goal. A qualitative project seeks depth and meaning, so the formula answers a question your study is not asking.

    What do I write in Chapter Three instead of a computation?

    A saturation justification: the sampling technique, the basis for the size with a citation, the fact that coding ran concurrently with collection, and the interview at which new themes stopped appearing plus your confirmation interviews.

    How many focus groups do I need?

    Four to eight discussions on the systematic review evidence. Count discussions rather than participants — one group of eight people is one focus group discussion.

    How few is too few?

    Below about eight becomes hard to defend for an interview study with more than one research question, because saturation has not been given a chance to appear. If circumstances force a smaller sample, declare it as a limitation rather than leaving the panel to find it.

    Do I have to reach saturation to pass?

    Not necessarily. Many undergraduate timelines make true saturation impractical. A project that states honestly that recruitment closed at the timetable rather than at saturation, and lists that as a limitation, is stronger than one claiming a saturation it cannot evidence.

    Can I combine interviews and focus groups?

    Yes, and it is common. Treat them as two data sources with two stopping rules and explain how they relate. Do not add ten interviews to four focus groups and report fourteen of anything.

    Does a qualitative project still need Chapter Four?

    Yes. It presents themes with supporting quotations rather than tables of frequencies, but the chapter is still where your data is reported and interpreted. The five-chapter structure itself is set out in the answer to how many chapters a Nigerian final year project has.

    Should my sample size appear in the abstract?

    Yes, and it must match Chapter Three, Chapter Four and any table that counts participants. A count that drifts between sections is among the most frequently caught defects in a project document.

    Are these studies relevant to Nigeria?

    Methodological guidance is cited for its method rather than its locale, and both are standard international references. The Guest and colleagues study is also directly relevant on its own terms, having been conducted on interviews in two West African countries. Pair them with any Nigerian study whose design resembles yours, using the synthesis method in the guide to writing Chapter Two.

    Where does the sample justification go in the proposal?

    In the methodology, written in the future tense — “recruitment will continue until saturation” — and converted to past tense once collection is complete. The full proposal structure is in the guide to writing a research proposal for a Nigerian final year project.

    Does my population figure still matter?

    You should still describe the population you drew participants from, because inclusion criteria have to make sense against it. What changes is that you do not convert that figure into a sample size arithmetically. The population description belongs in Chapter One’s scope as well, which is covered in the guide to writing Chapter One.